Riders and events
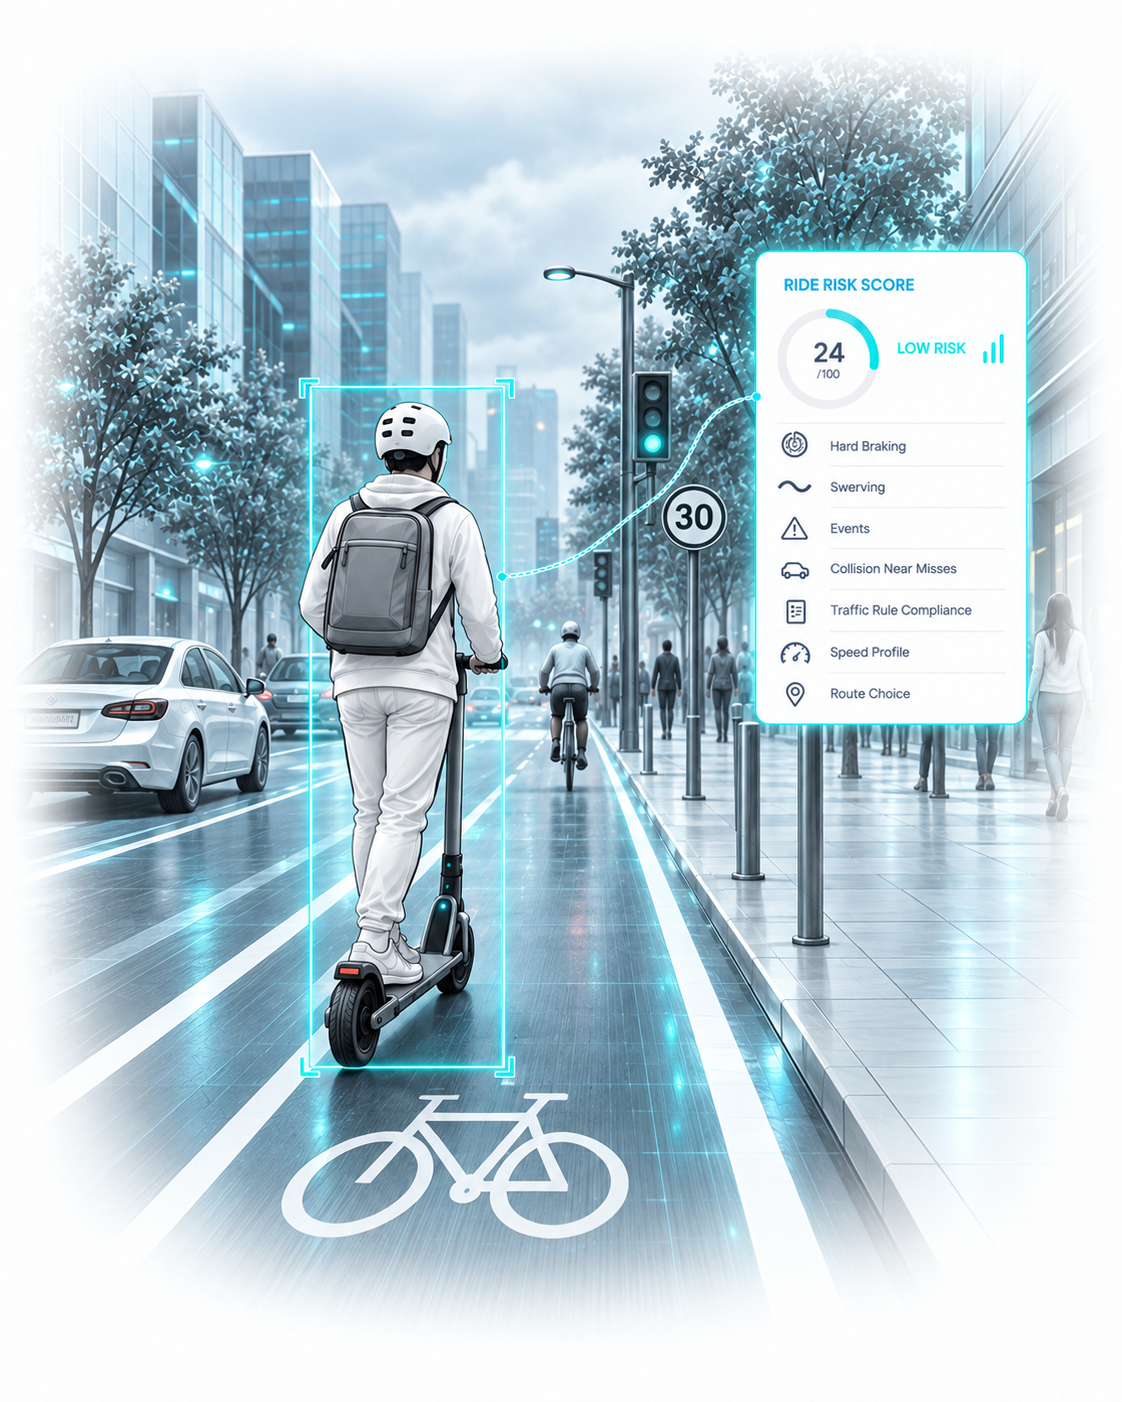
Ride/r risk scoring
Quantifying how risky or safely a person or vehicle rides.
Risk-scoring riders and rides based on behaviour, events, and external conditions
RIDE INTELLIGENCE PLATFORM
We turn every ride into data: a continuous and detailed record of what happened and where. On any hardware stack, even your smartphone.

'%3e%3cmetadata%20id='metadata13'%3e%3crdf:RDF%3e%3ccc:Work%20rdf:about=''%3e%3cdc:format%3eimage/svg+xml%3c/dc:format%3e%3cdc:type%20rdf:resource='http://purl.org/dc/dcmitype/StillImage'%20/%3e%3cdc:title%3eTUM_Web_Logo_blau%3c/dc:title%3e%3c/cc:Work%3e%3c/rdf:RDF%3e%3c/metadata%3e%3cdefs%20id='defs11'%20/%3e%3csodipodi:namedview%20pagecolor='%23ffffff'%20bordercolor='%23666666'%20borderopacity='1'%20objecttolerance='10'%20gridtolerance='10'%20guidetolerance='10'%20inkscape:pageopacity='0'%20inkscape:pageshadow='2'%20inkscape:window-width='1920'%20inkscape:window-height='986'%20id='namedview9'%20showgrid='false'%20fit-margin-top='0'%20fit-margin-left='0'%20fit-margin-right='0'%20fit-margin-bottom='0'%20inkscape:zoom='1.754386'%20inkscape:cx='124.61021'%20inkscape:cy='115.2546'%20inkscape:window-x='-11'%20inkscape:window-y='-11'%20inkscape:window-maximized='1'%20inkscape:current-layer='Ebene_1'%20/%3e%3ctitle%20id='title2'%3eTUM_Web_Logo_blau%3c/title%3e%3cdesc%20id='desc4'%3eTUM%3c/desc%3e%3cpath%20fill='%233070b3'%20d='m%20140.54052,-31%20v%20173.32822%20h%2044.72985%20V%20-31%20H%20392.146%20V%20181.46685%20H%20353.00738%20V%208.138629%20H%20308.2775%20V%20181.46685%20H%20269.13887%20V%208.138629%20H%20224.40902%20V%20181.46685%20H%20101.4019%20V%208.138629%20H%2062.26327%20V%20181.46685%20H%2023.12462%20V%208.138629%20H%20-16.014%20V%20-31%20Z'%20id='path6'%20style='stroke-width:5.59123'%20/%3e%3c/svg%3e)








Aircraft, trucks and cars are measured continuously. Every trip leaves a record that can be checked against a standard.
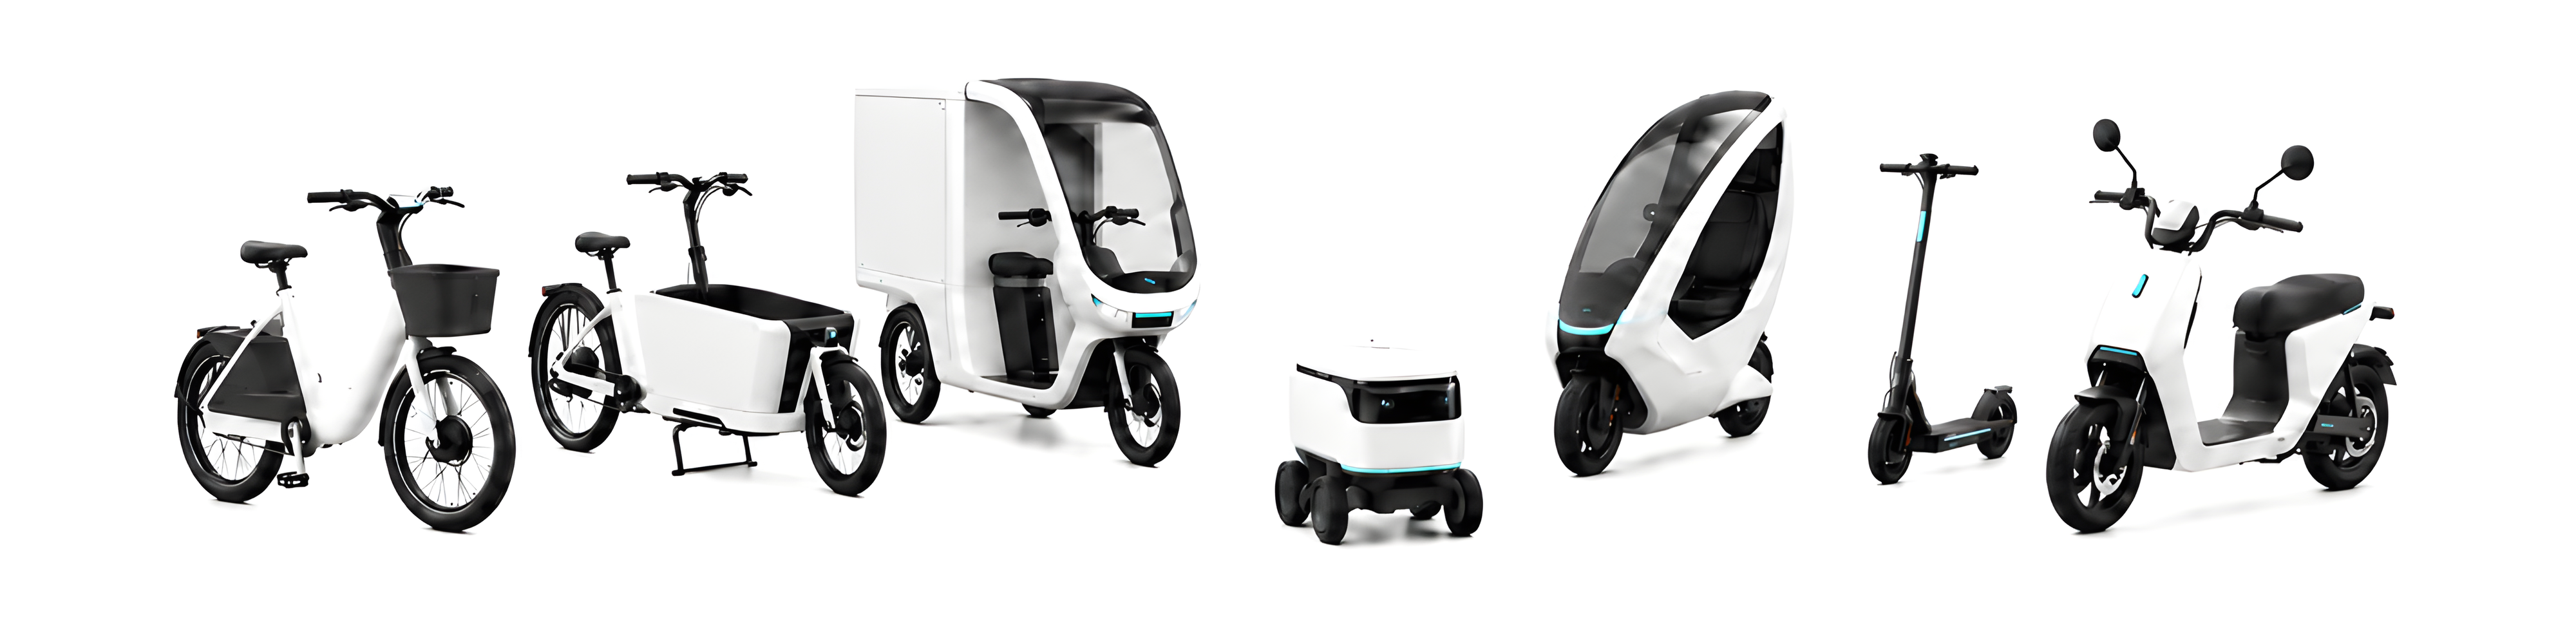
Light vehicles such as bicycles, cargo bikes, e-scooters and e-mopeds now carry a serious share of urban traffic and urban logistics. Almost none of it is measured. Routes, traffic flow, risk profiles, speeds and rule adherence remain largely unknown.
BlossomEdge closes that gap, without any new hardware on the vehicle.
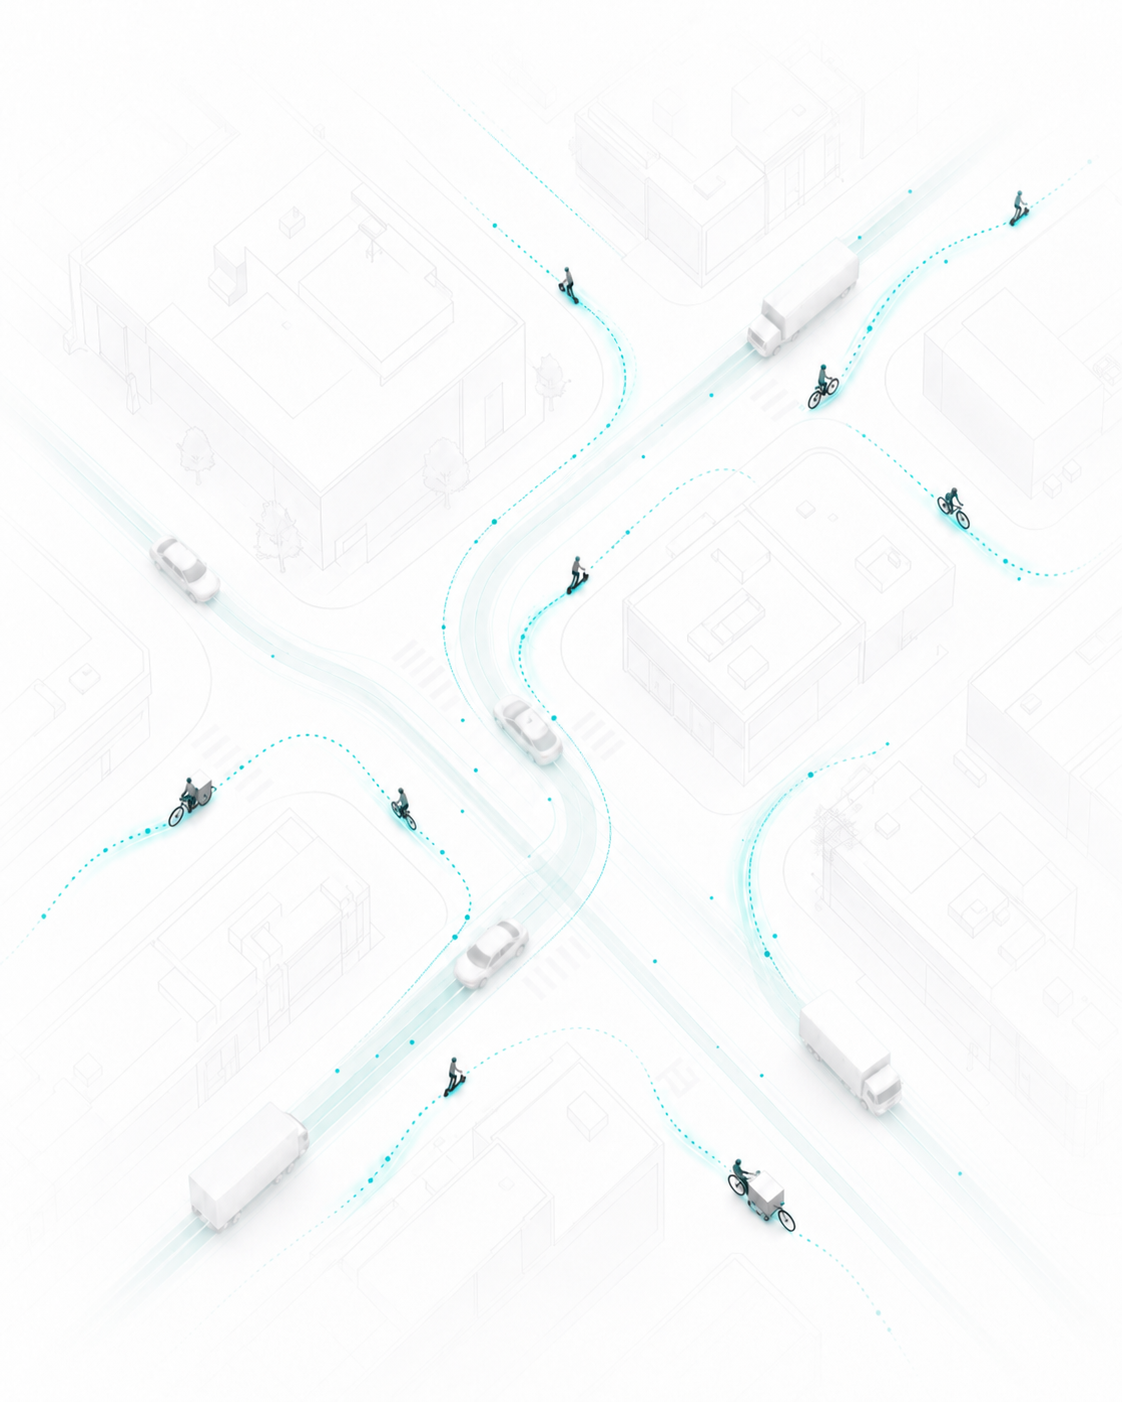
01 CAPTURE
On-device AI detects relevant information and records video, sensor input, location and time in real time.
02 FUSE
BlossomEdge data combines with public and client data.
03 INTERPRET
Cloud AI reads the combined record and generates critical insights and signals.
04 OUTPUT
Dashboards, reports, behaviour analysis, API events for downstream systems and apps
We generate insights on several levels of abstraction to inform decisions or drive automations in downstream systems.
Raw Sensor Data
01 / 10
Riders and events
Quantifying how risky or safely a person or vehicle rides.
Risk-scoring riders and rides based on behaviour, events, and external conditions
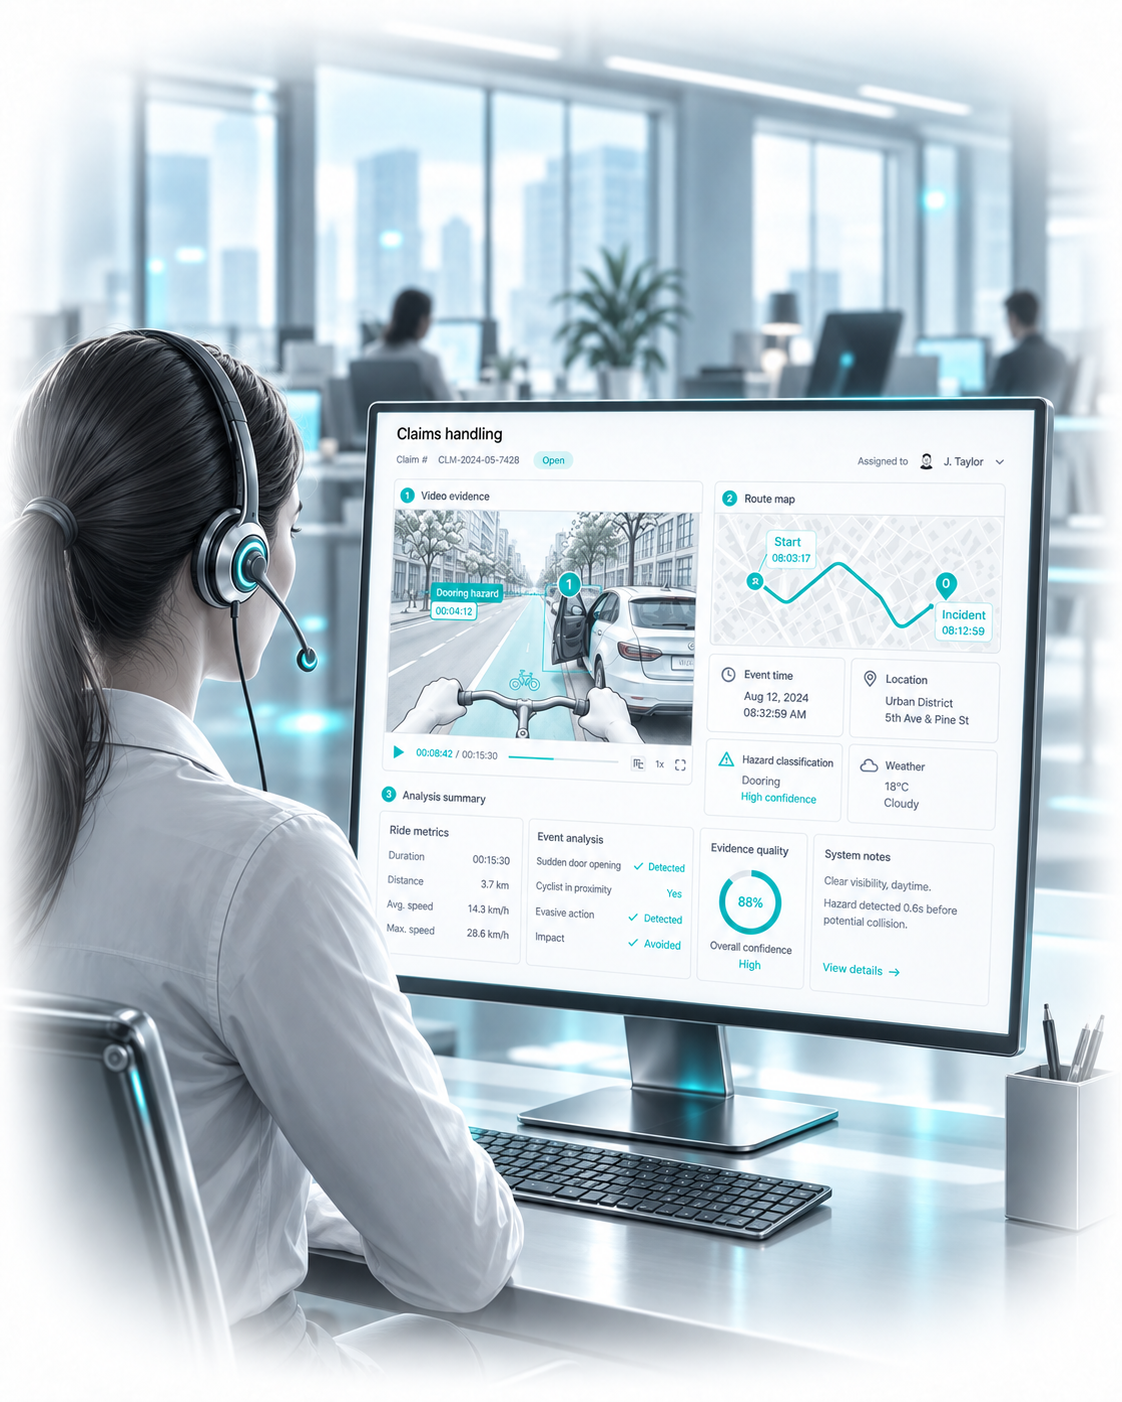
Riders and events
Evidence that settles what happened.
A record of what happened, where and when, instead of two conflicting accounts.
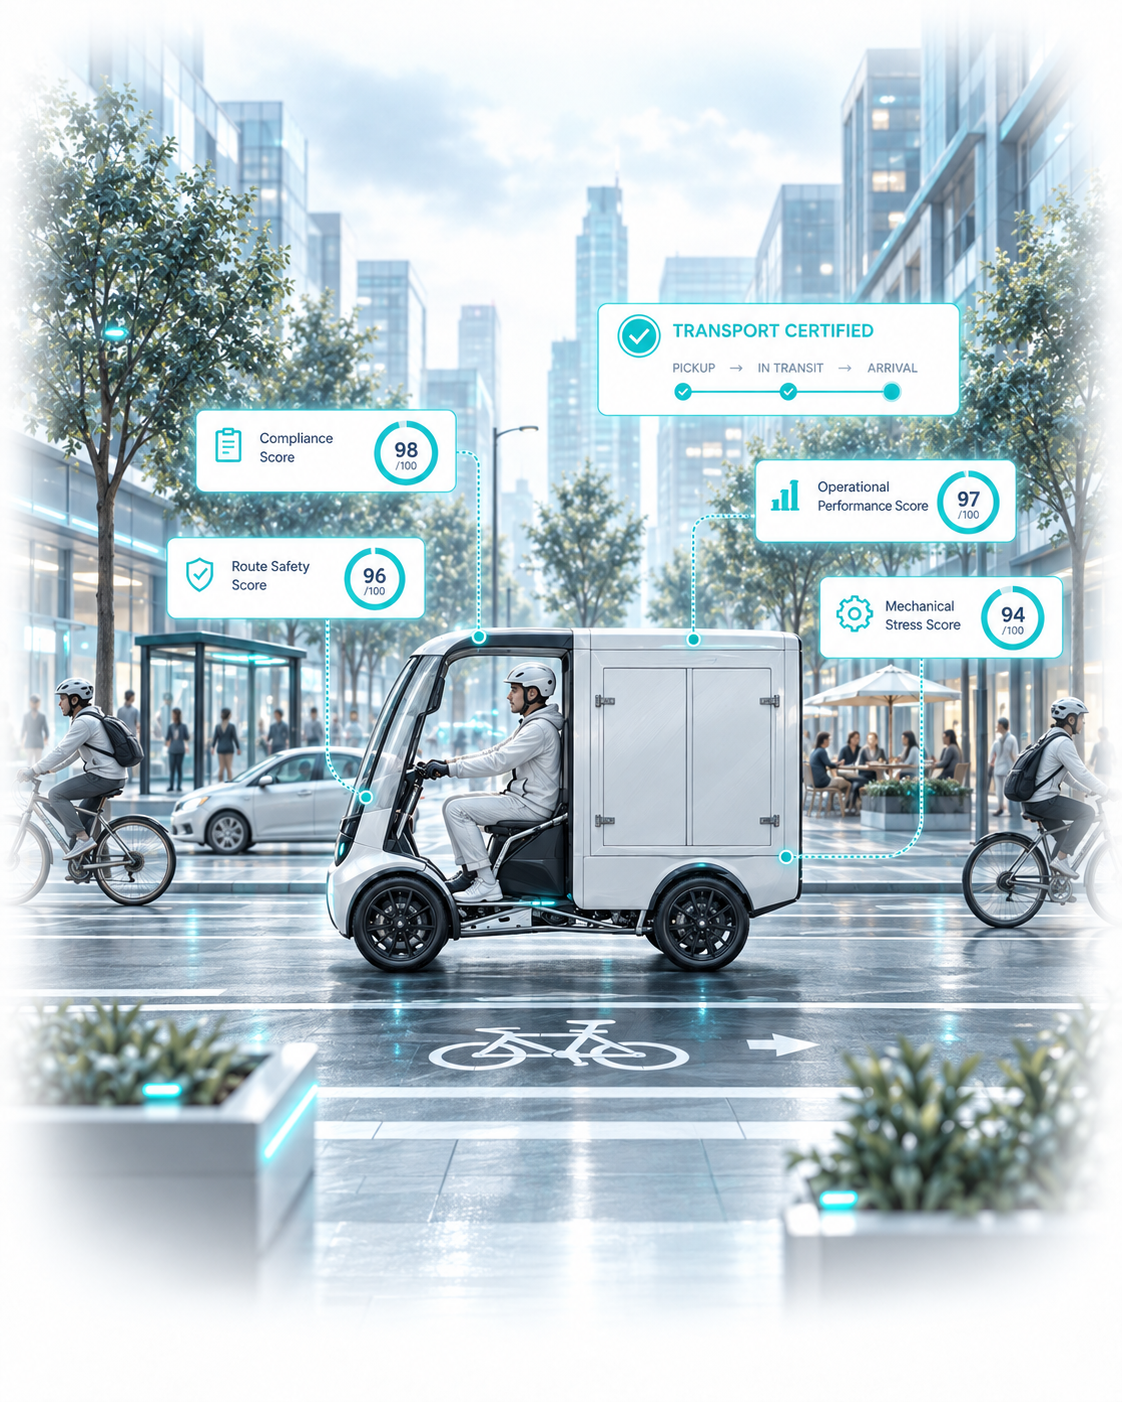
Rides and vehicles
Evidence of transport quality, end to end.
Proof that a transport met a defined quality standard, from pickup to arrival.
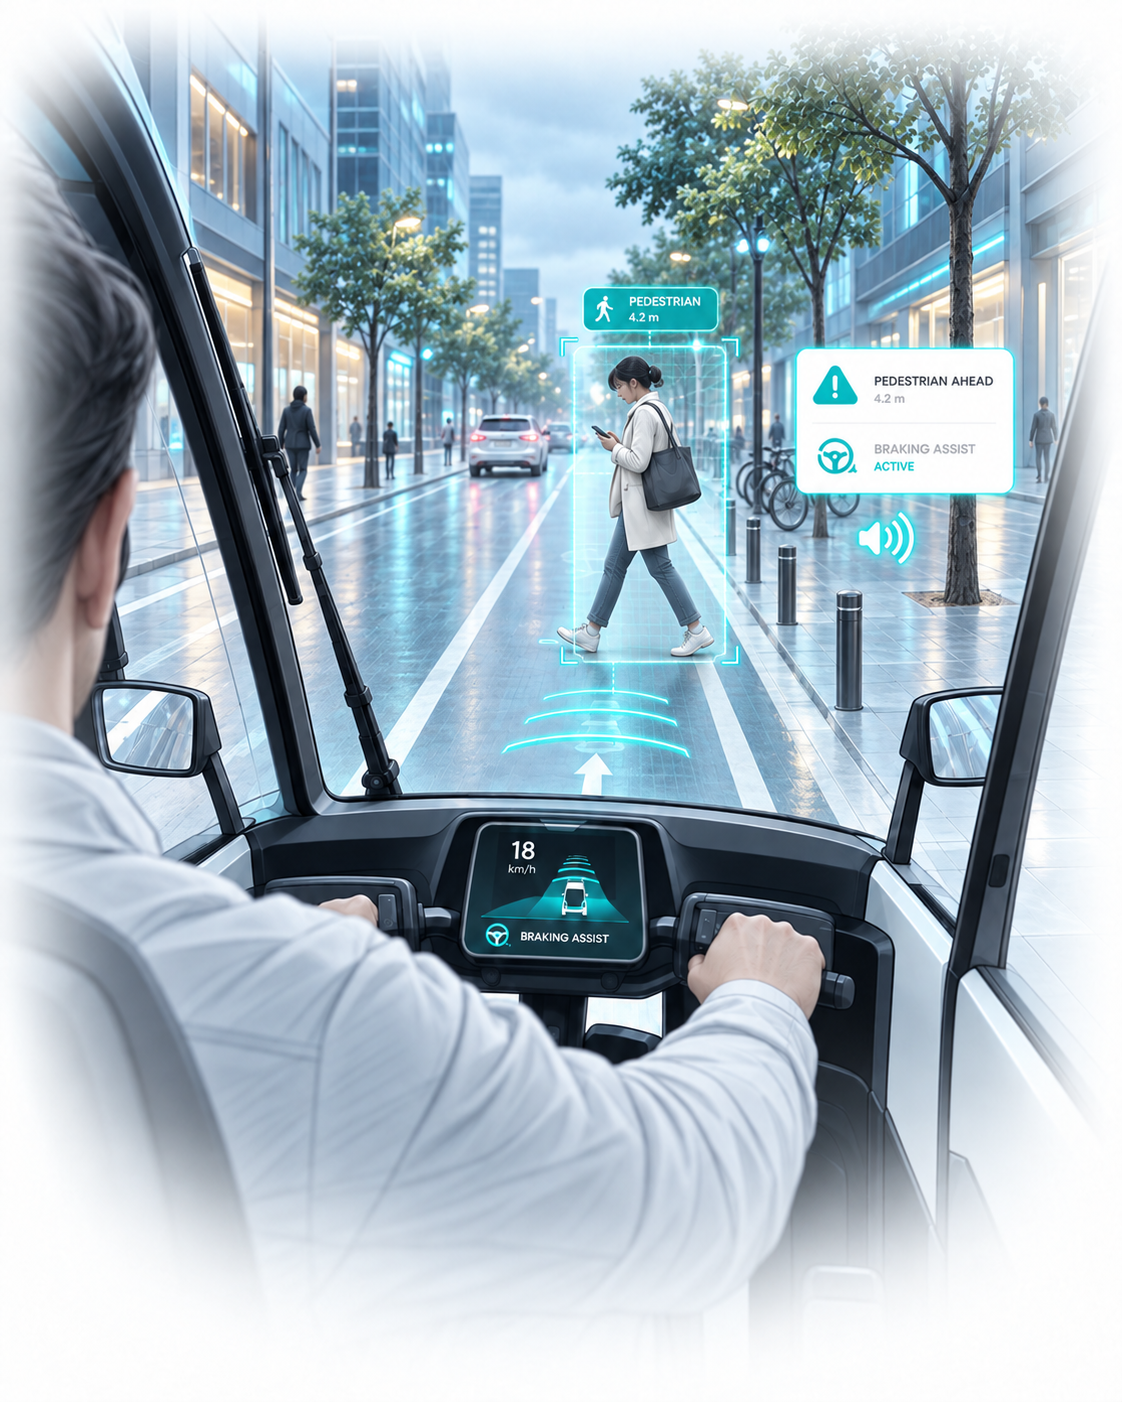
Rides and vehicles
Warnings the vehicle gives while riding.
Real-time hazard warning inside an e-bike, a scooter or a moped.
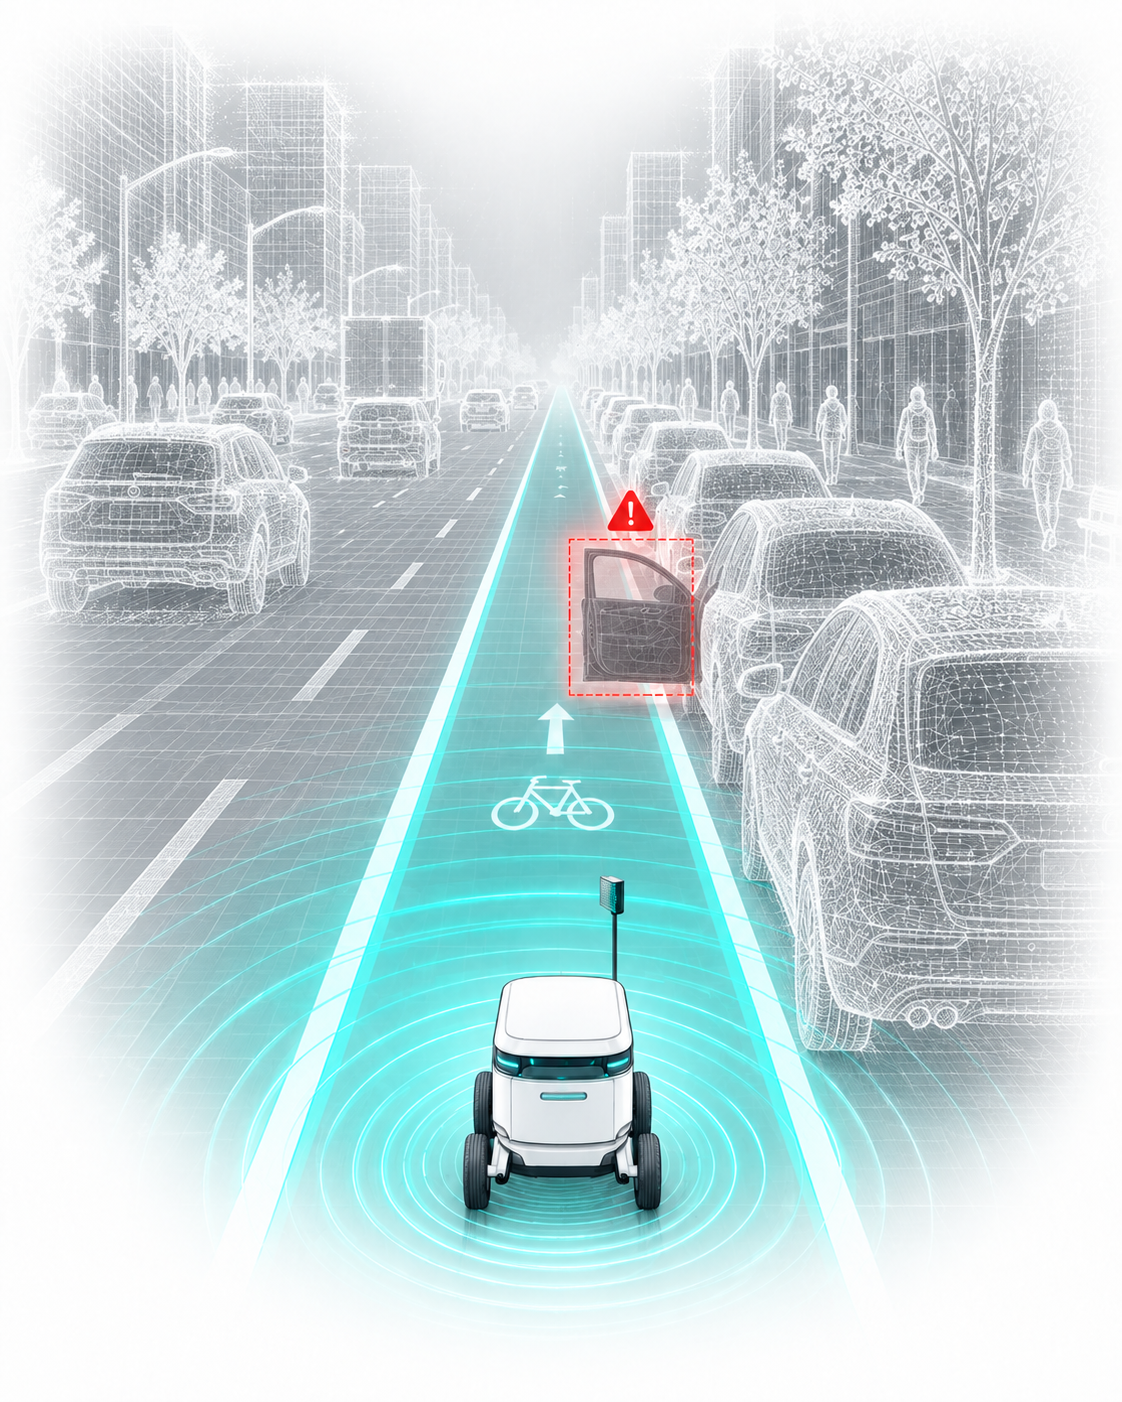
Rides and vehicles
Risk perception for light autonomous vehicles.
Real-time risk perception for PDDs and other light autonomous vehicles as input to their self-driving stack
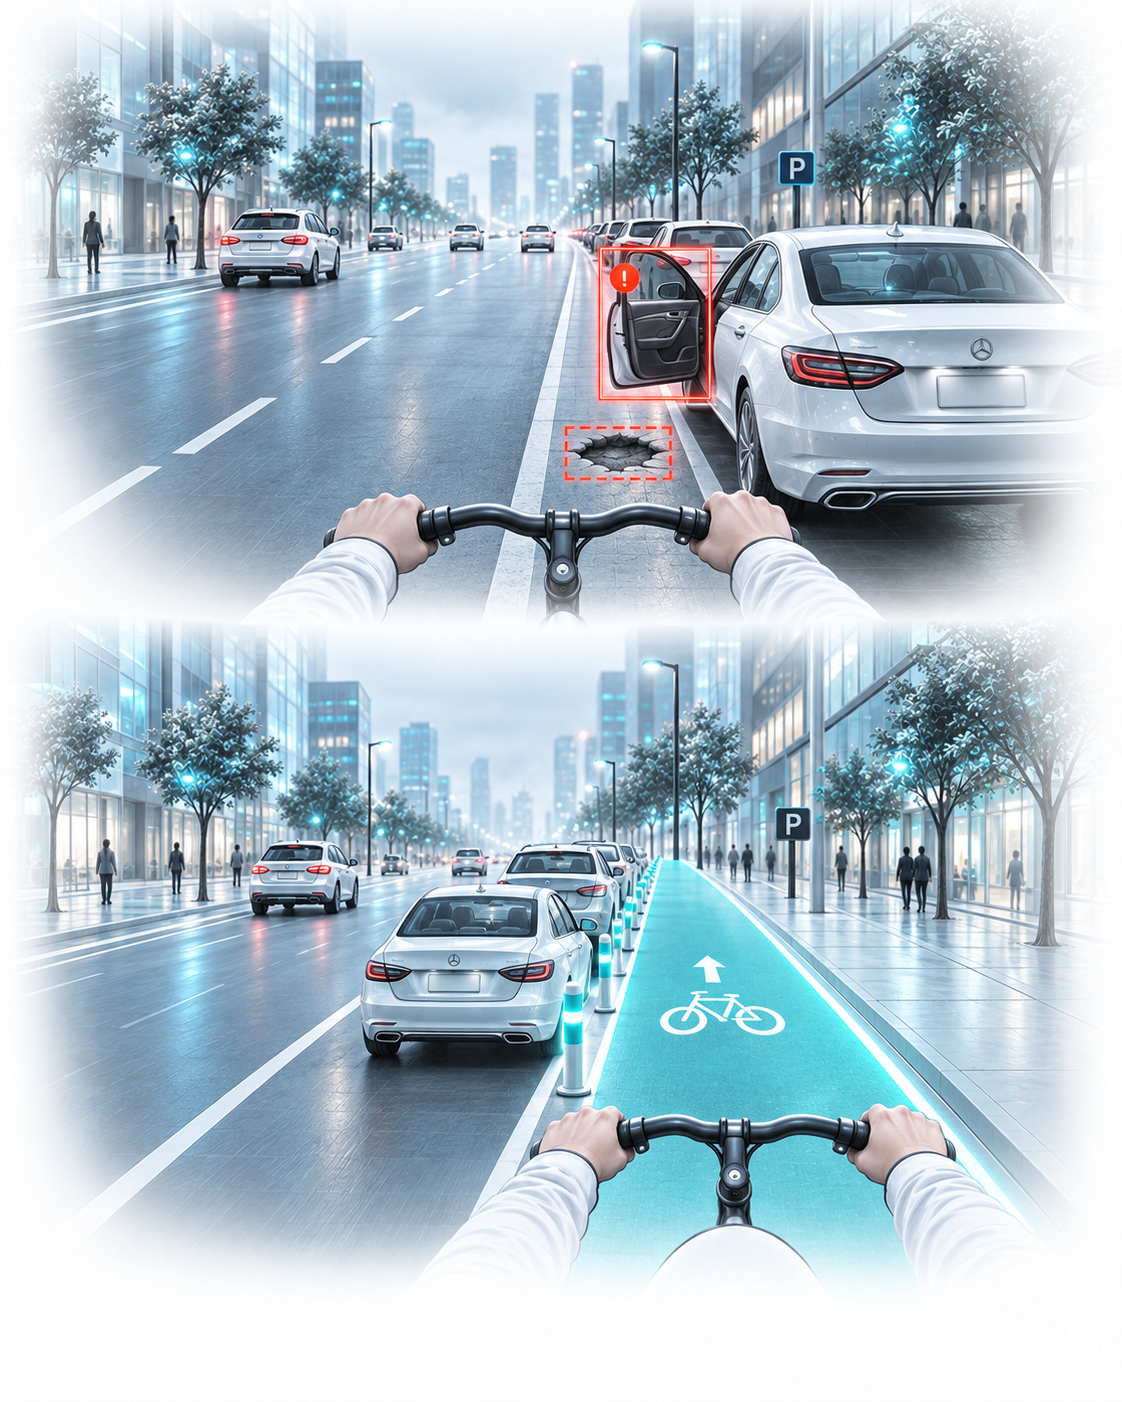
Streets and networks
Evidence for where to build and proof of what it changed.
Hazard evidence before a crash happens, and a measure of what actually changed after a road was rebuilt.
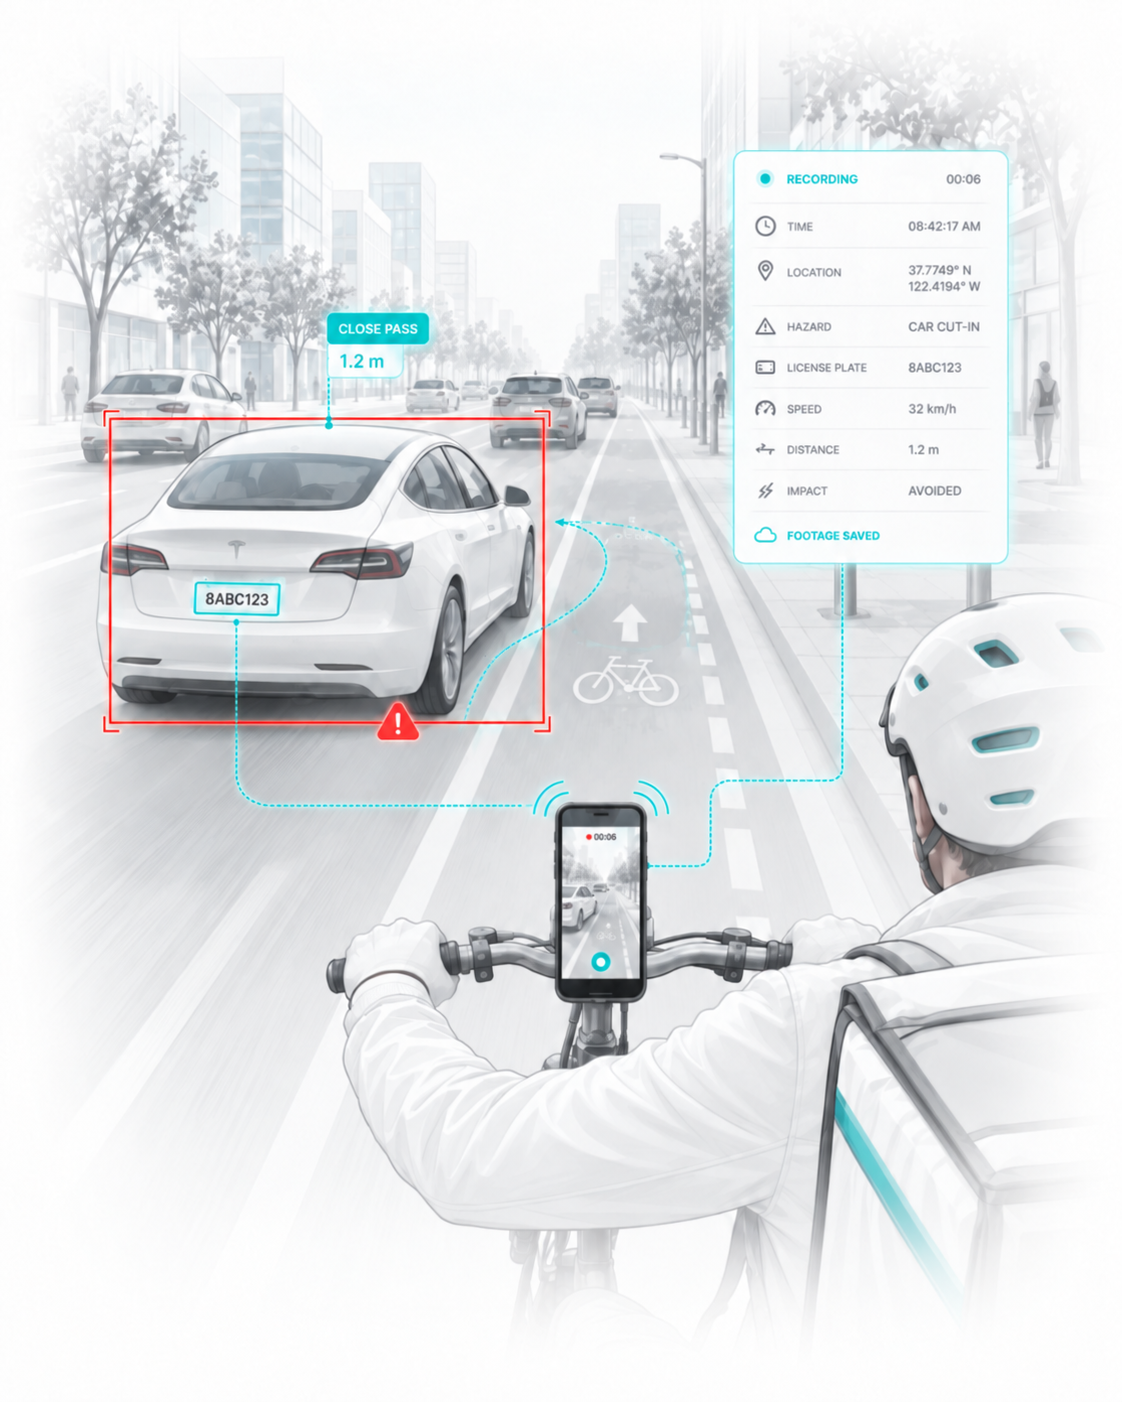
Riders and events
Incident footage, in an app or a device.
Continuous recording that keeps the seconds around an incident. As an app, or built into hardware.
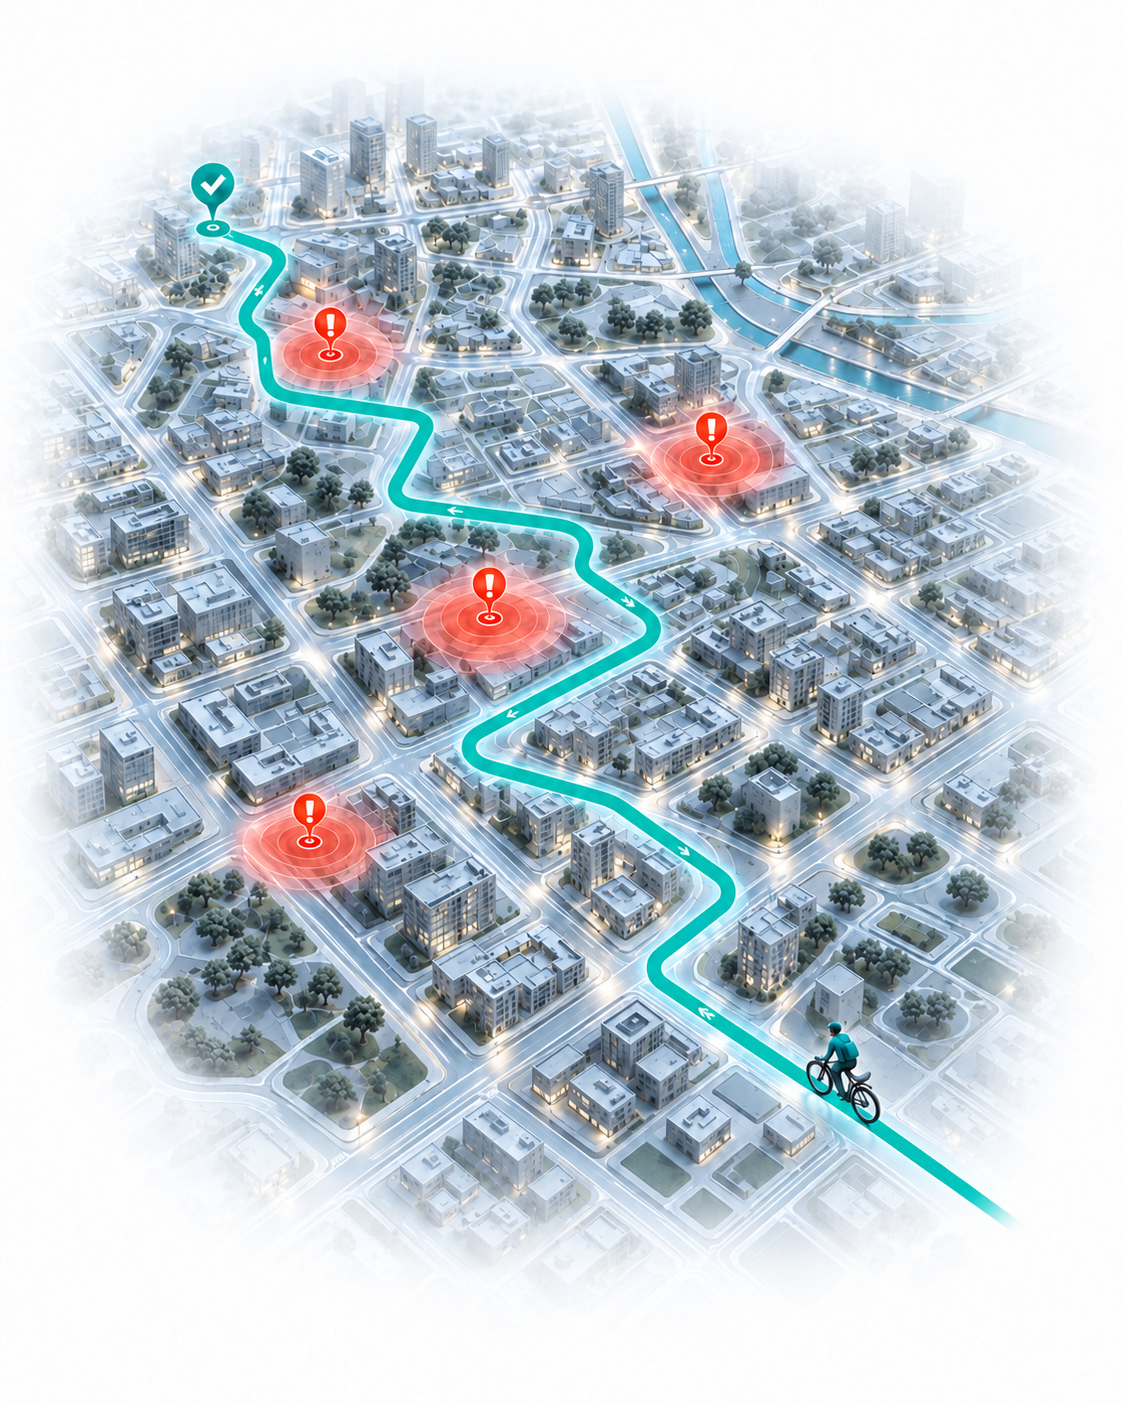
Streets and networks
Routing that accounts for risk, not only distance.
We tell you where the dangerous spots are, so you can route a rider, a user or a cargo around them.
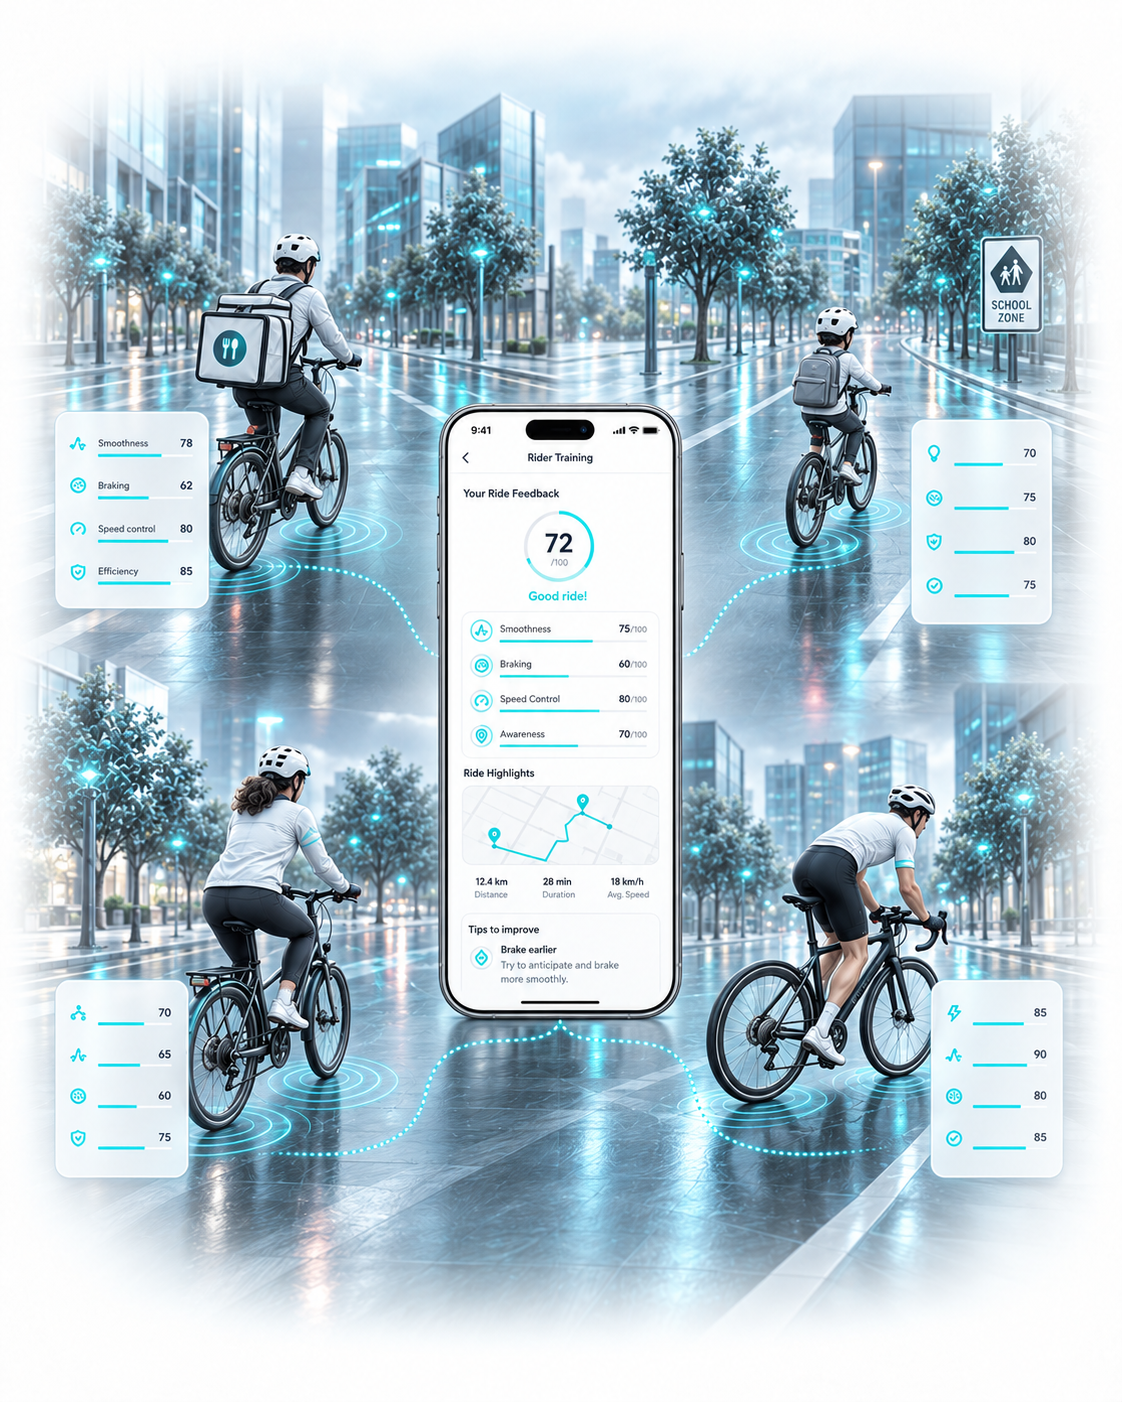
Riders and events
Feedback for beginners, delivery riders, other professionals, and children
Feedback on how someone actually rides. For children learning the route to school, for adults returning to a bike, and for professional riders.
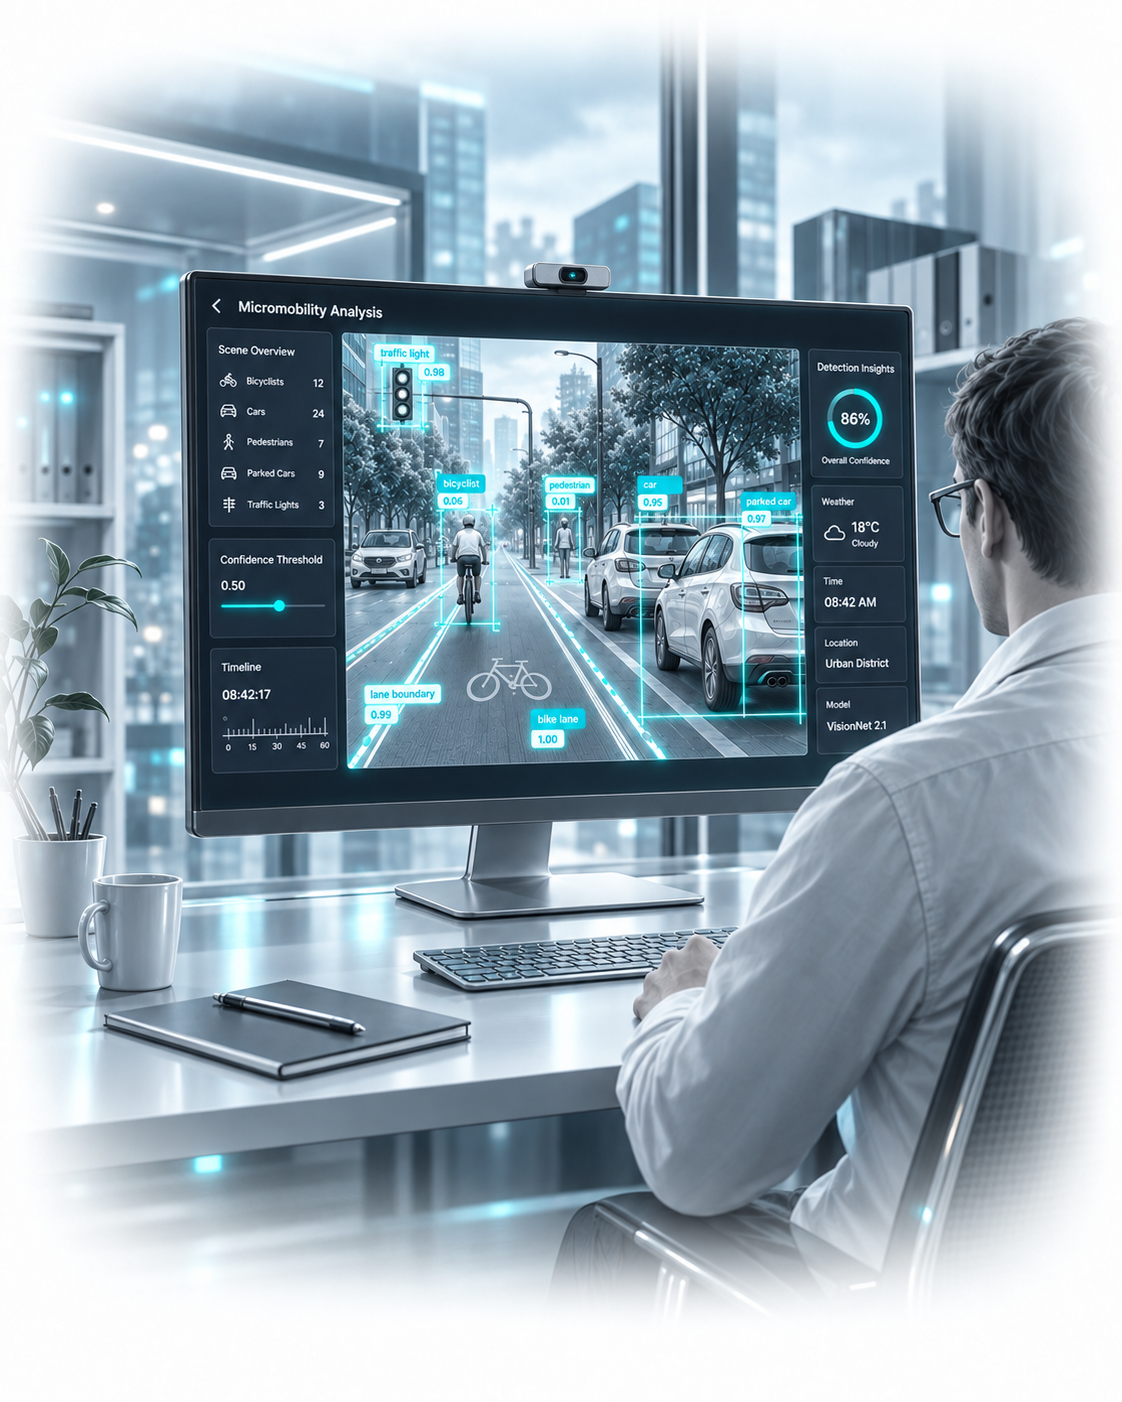
Streets and networks
Field data for road safety and mobility research.
Structured field data on risk, behaviour and infrastructure, collected under real conditions.
Do you see yourself in these use cases? We would like to hear from you.
Get in touchAll street level data is backed by video, post-processed for QA, and labelled against risk taxonomies. Collected across several cities and several kinds of rider.
None of it can be reconstructed after the fact from GPS traces or crash reports.
34.241
hazards detected
21
cities
15.233
km analysed
5
active projects
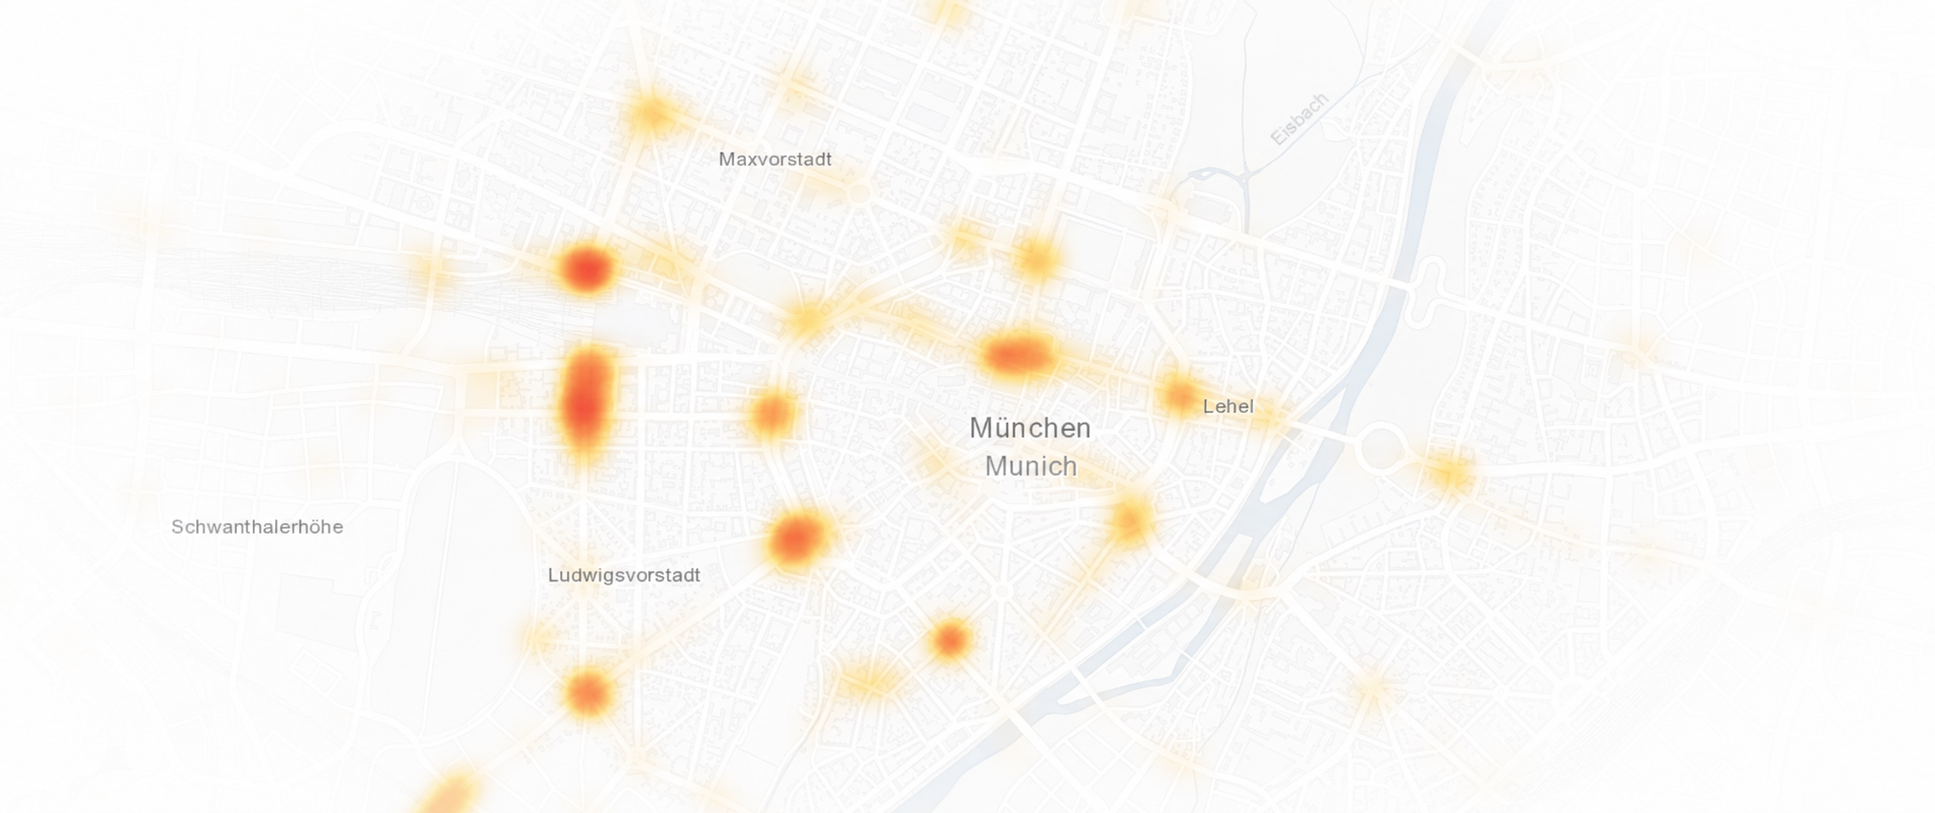
Each runs with a named partner organisation.
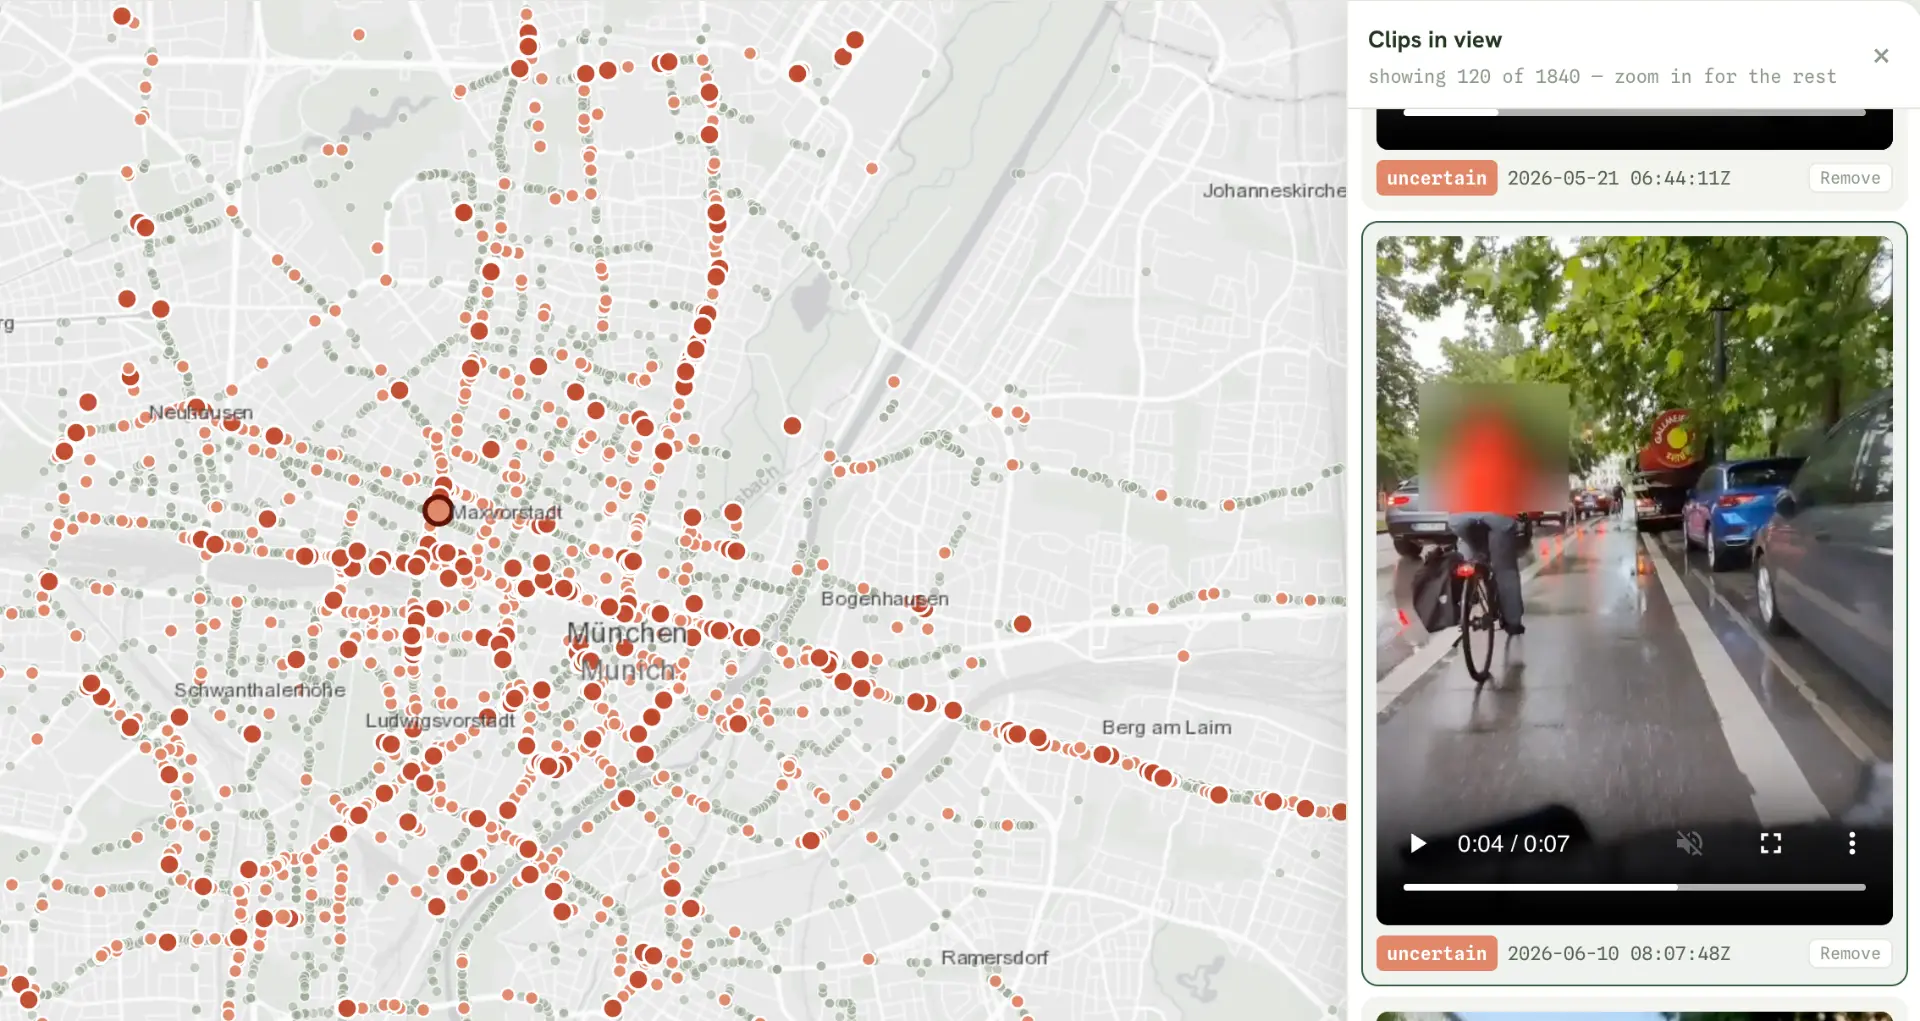
Field study with Prof. Dr. Henrike Rau of LMU's Professorship in Social Geography on how the risk riders feel relates to the risk the models measure.
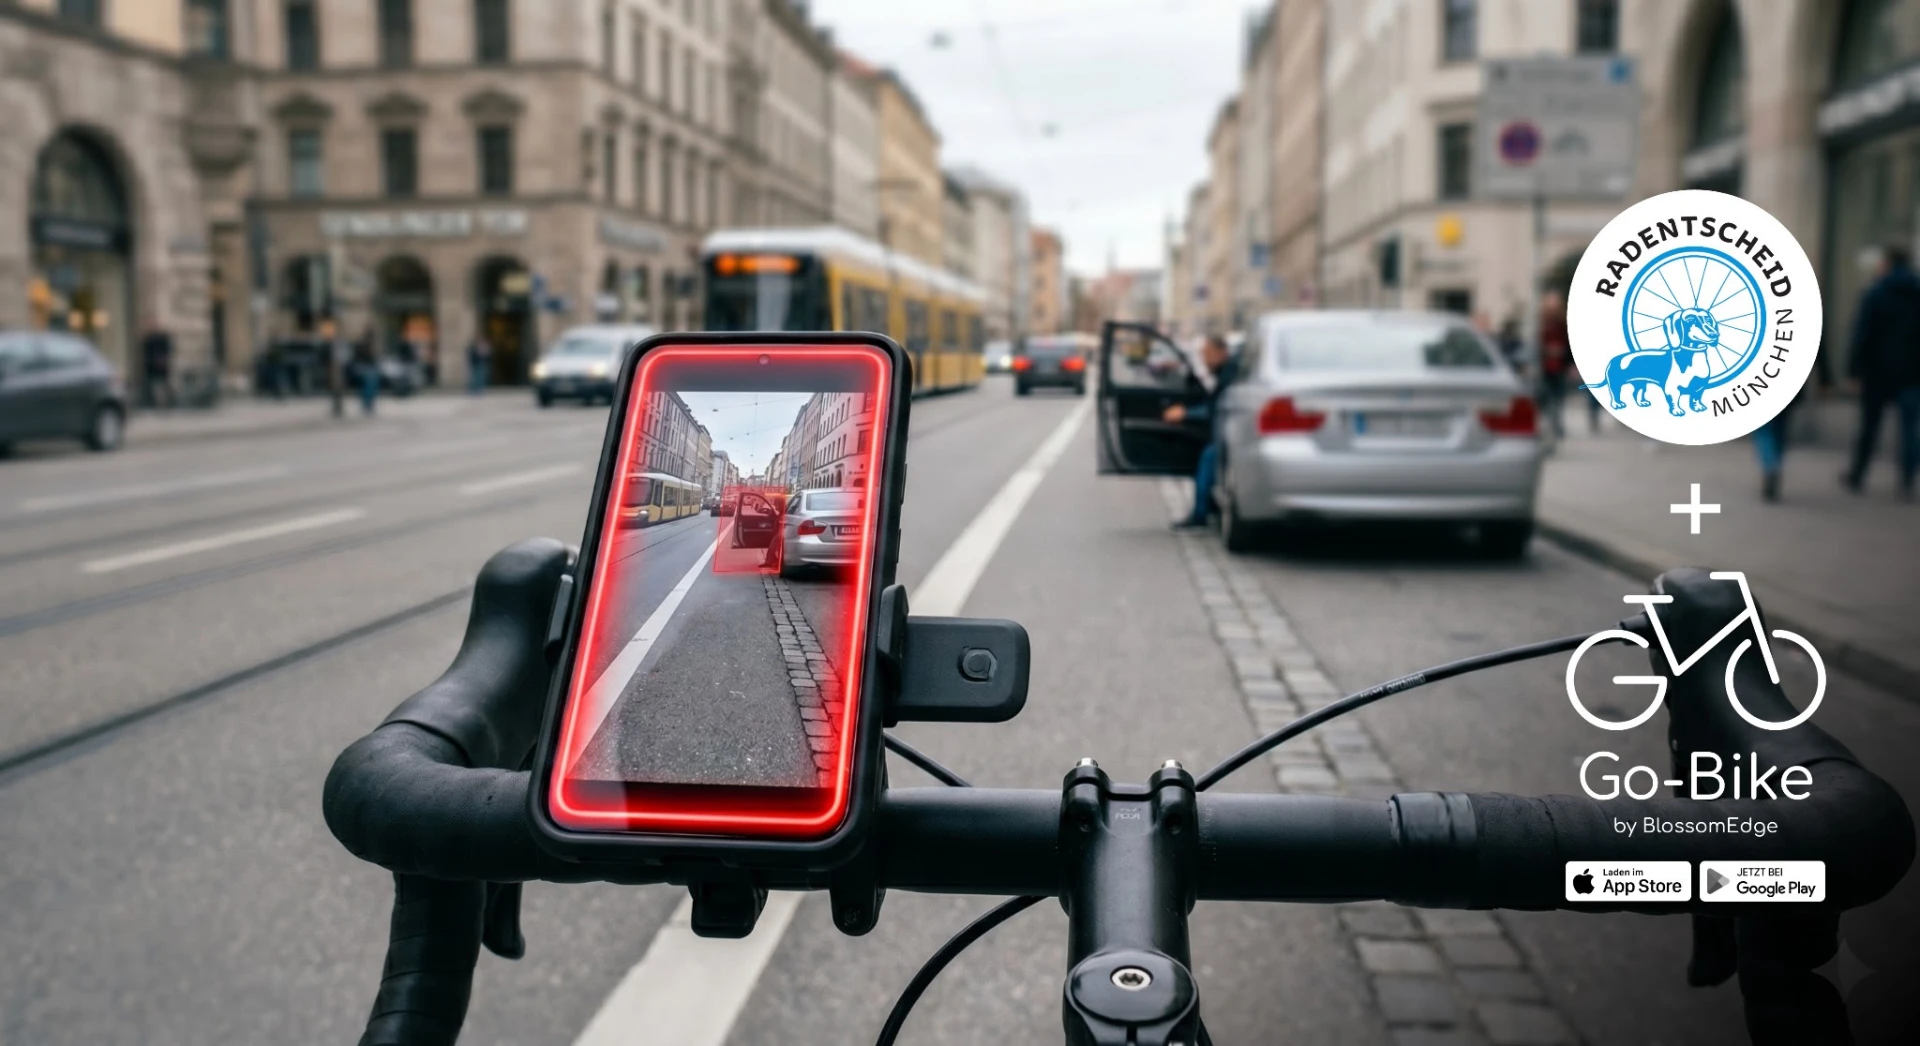
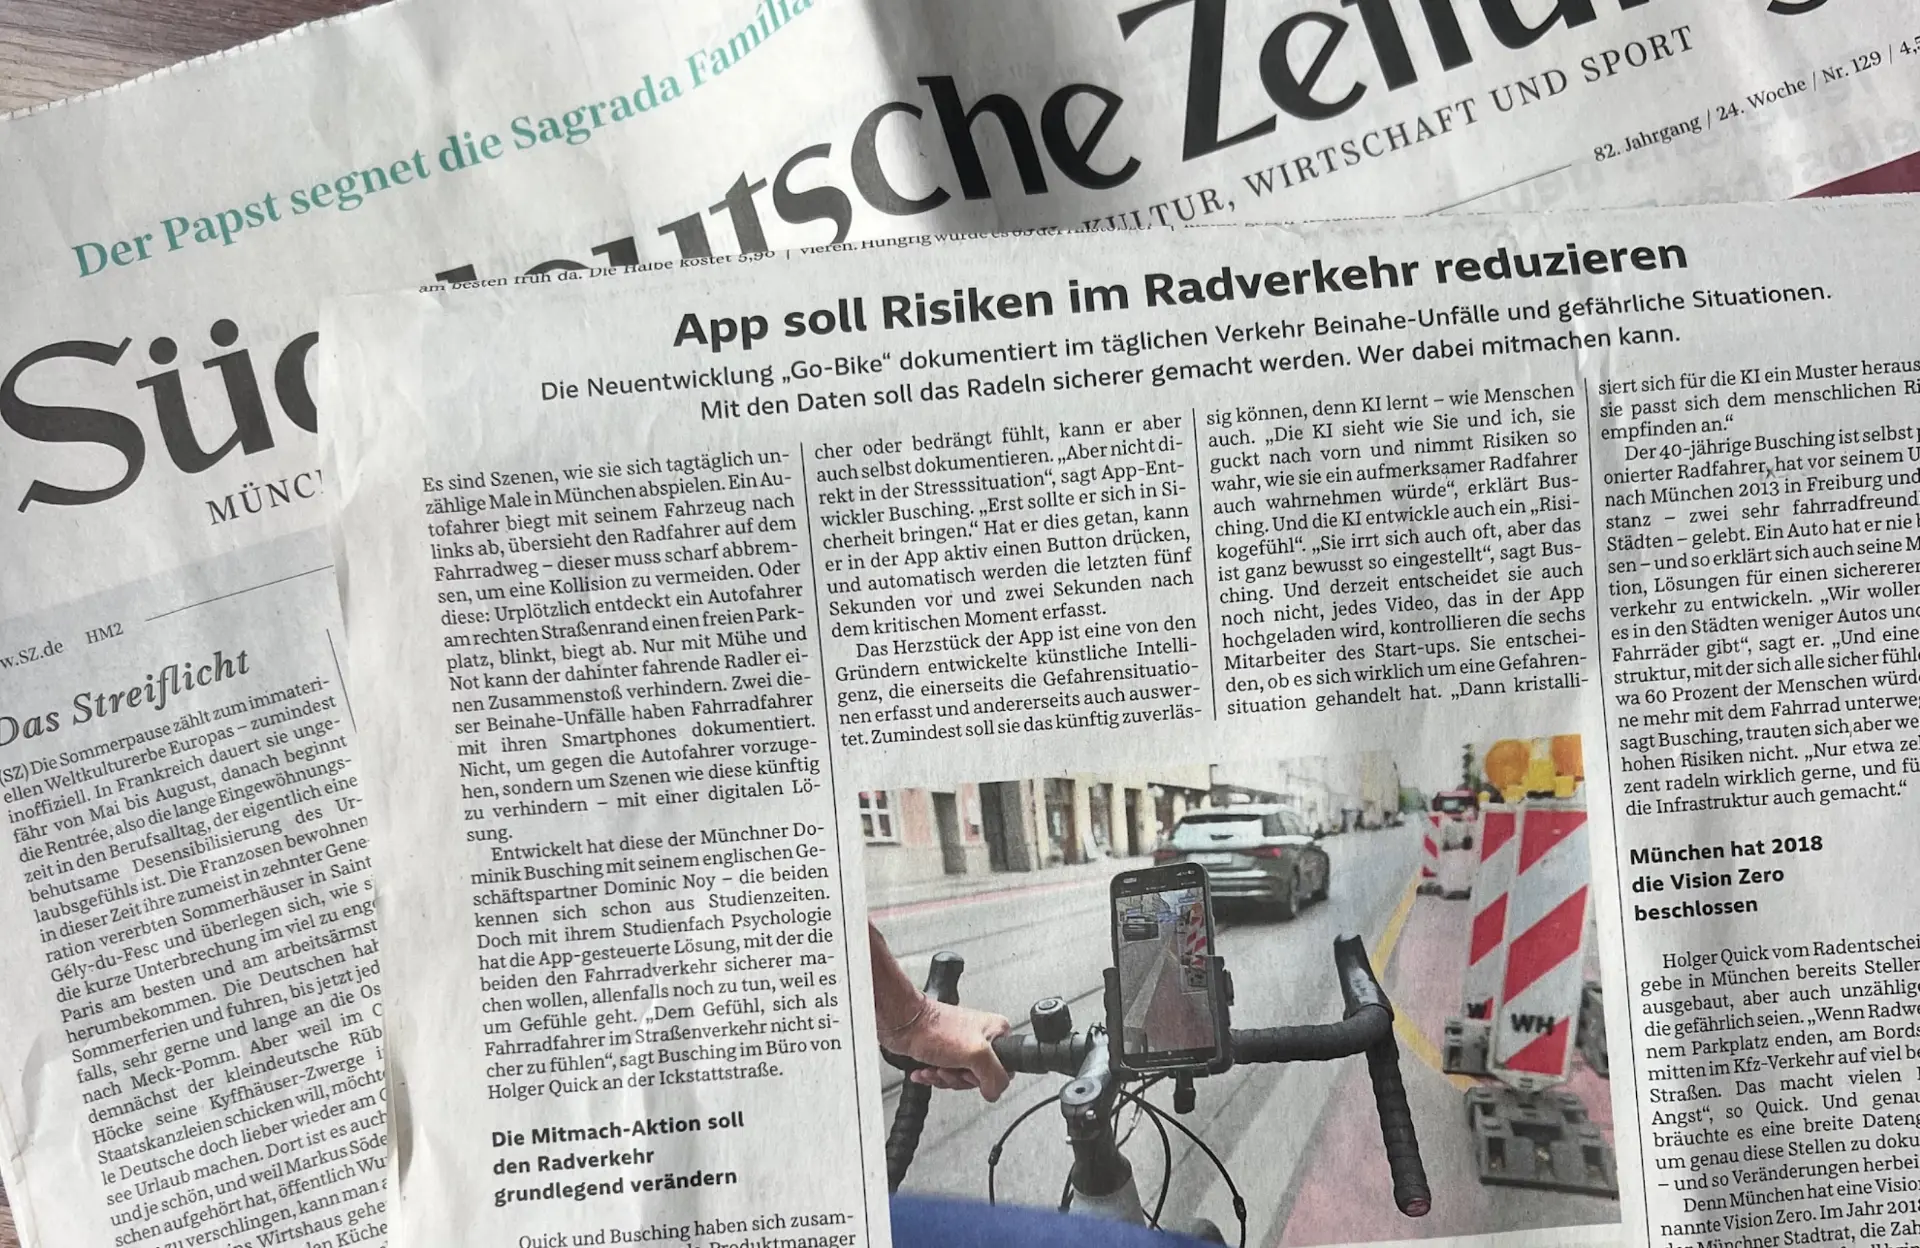
Rider-collected hazard evidence for infrastructure decisions in Munich.
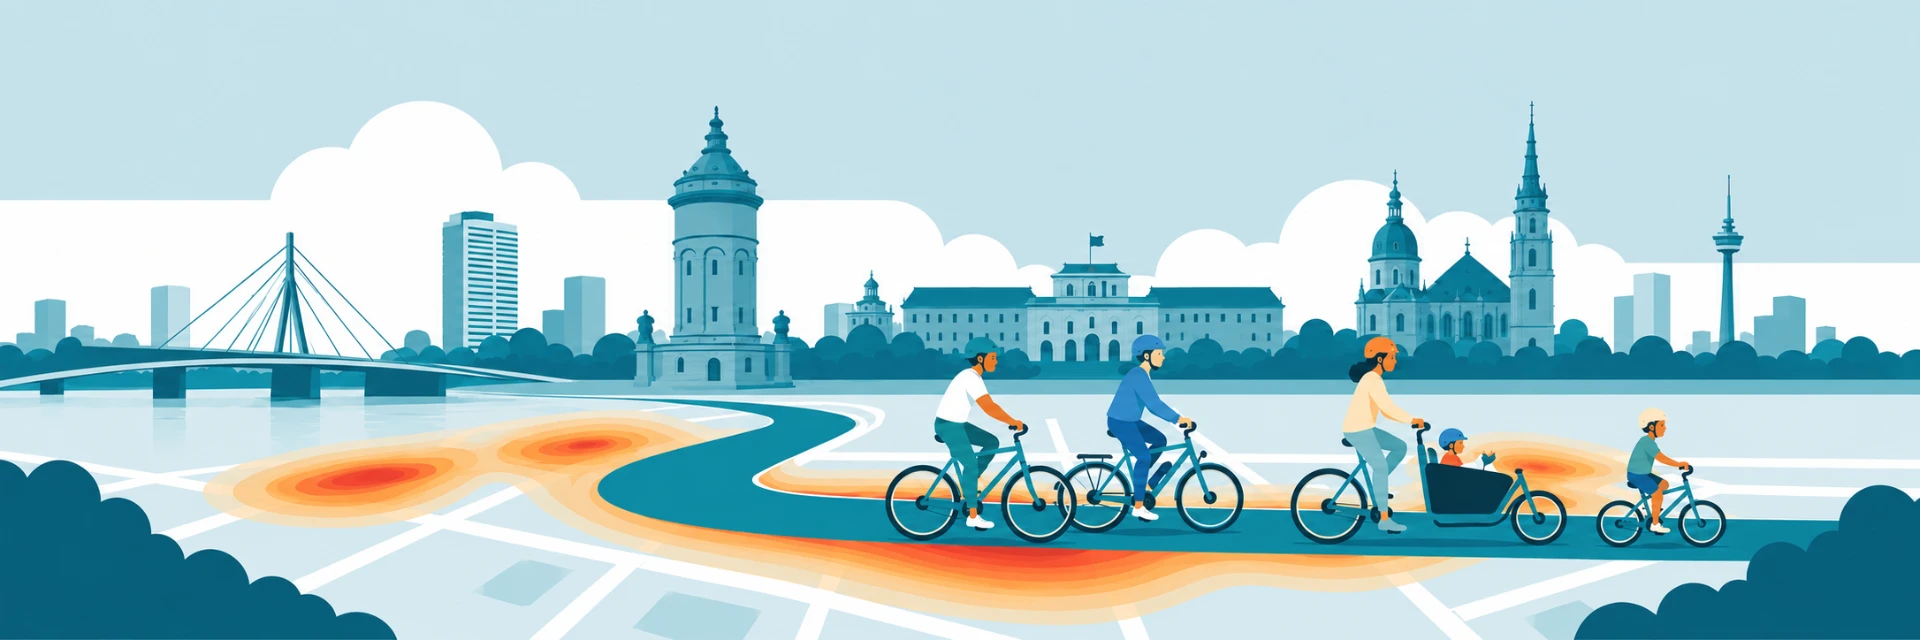
Creating a cycling hazard map for Baden-Württemberg's 2nd largest city
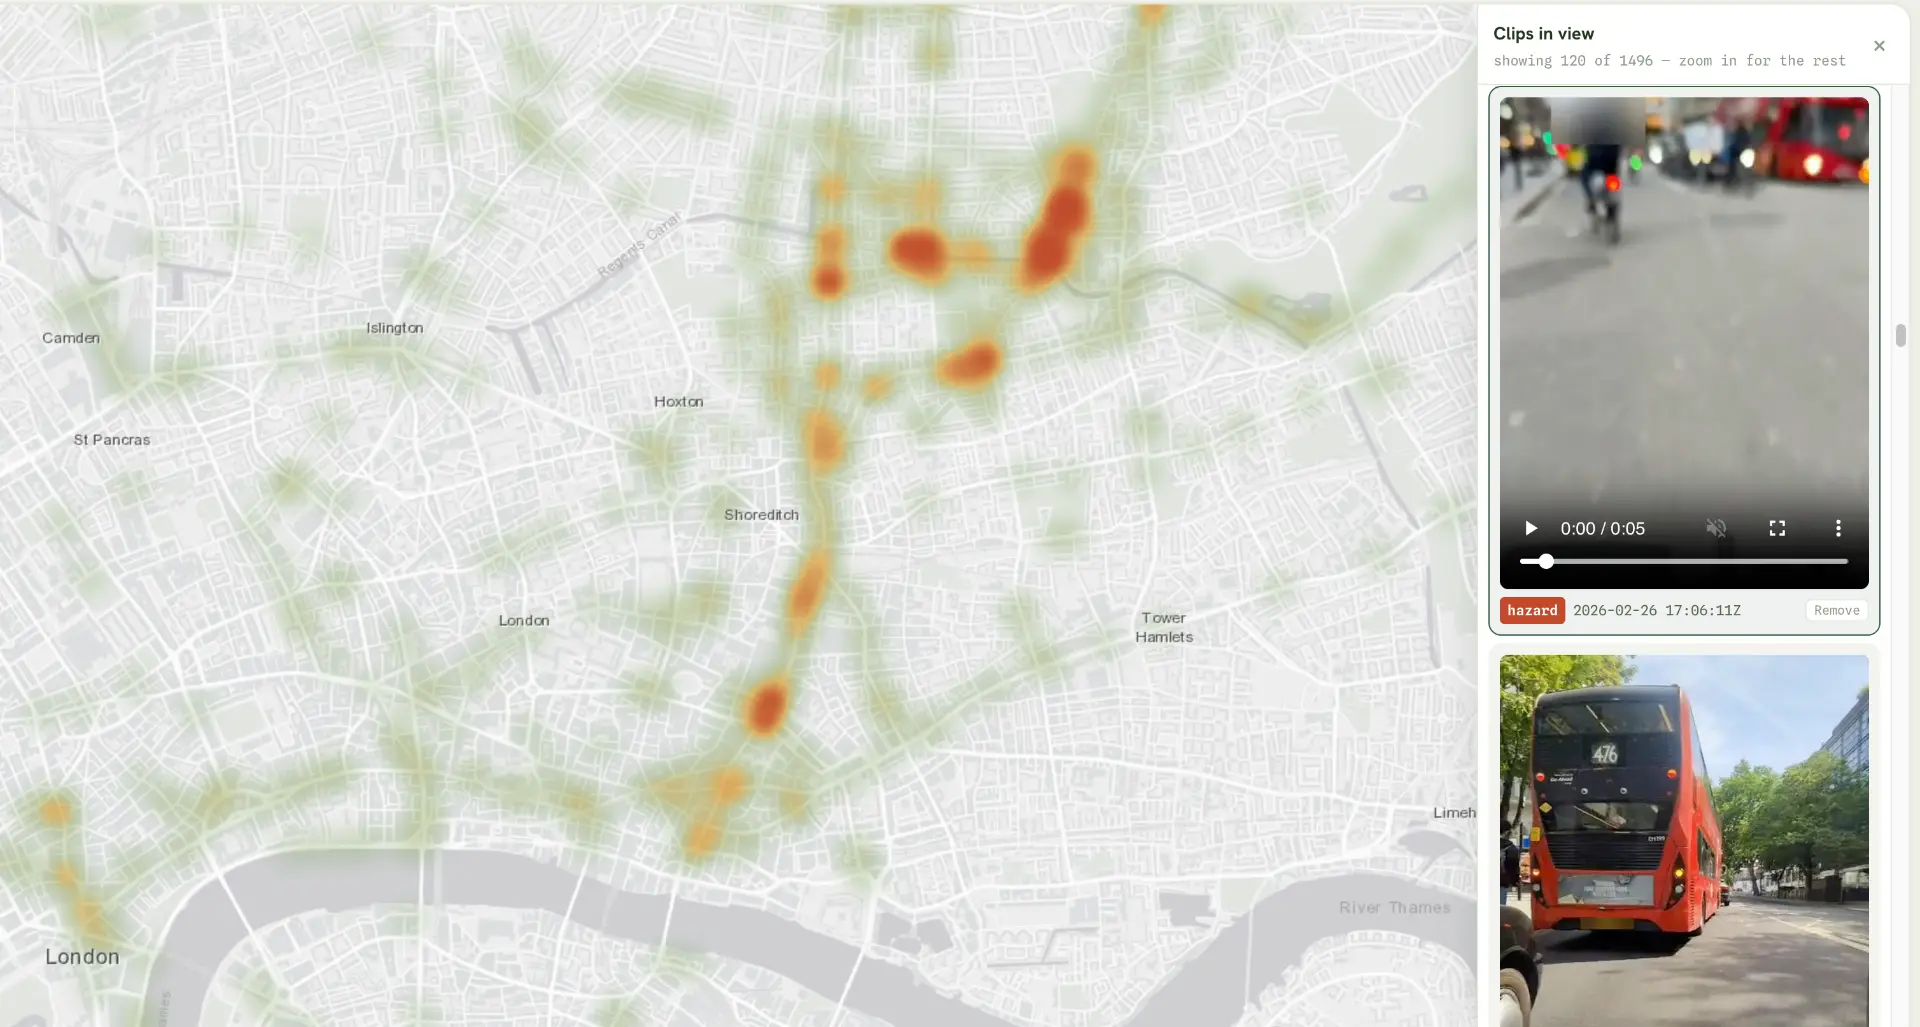
UK field study collecting hazard data with a local cycling organisation.
Further work runs with Technical University Munich and with partners in Amsterdam, Cambridge, Augsburg, and Cologne.
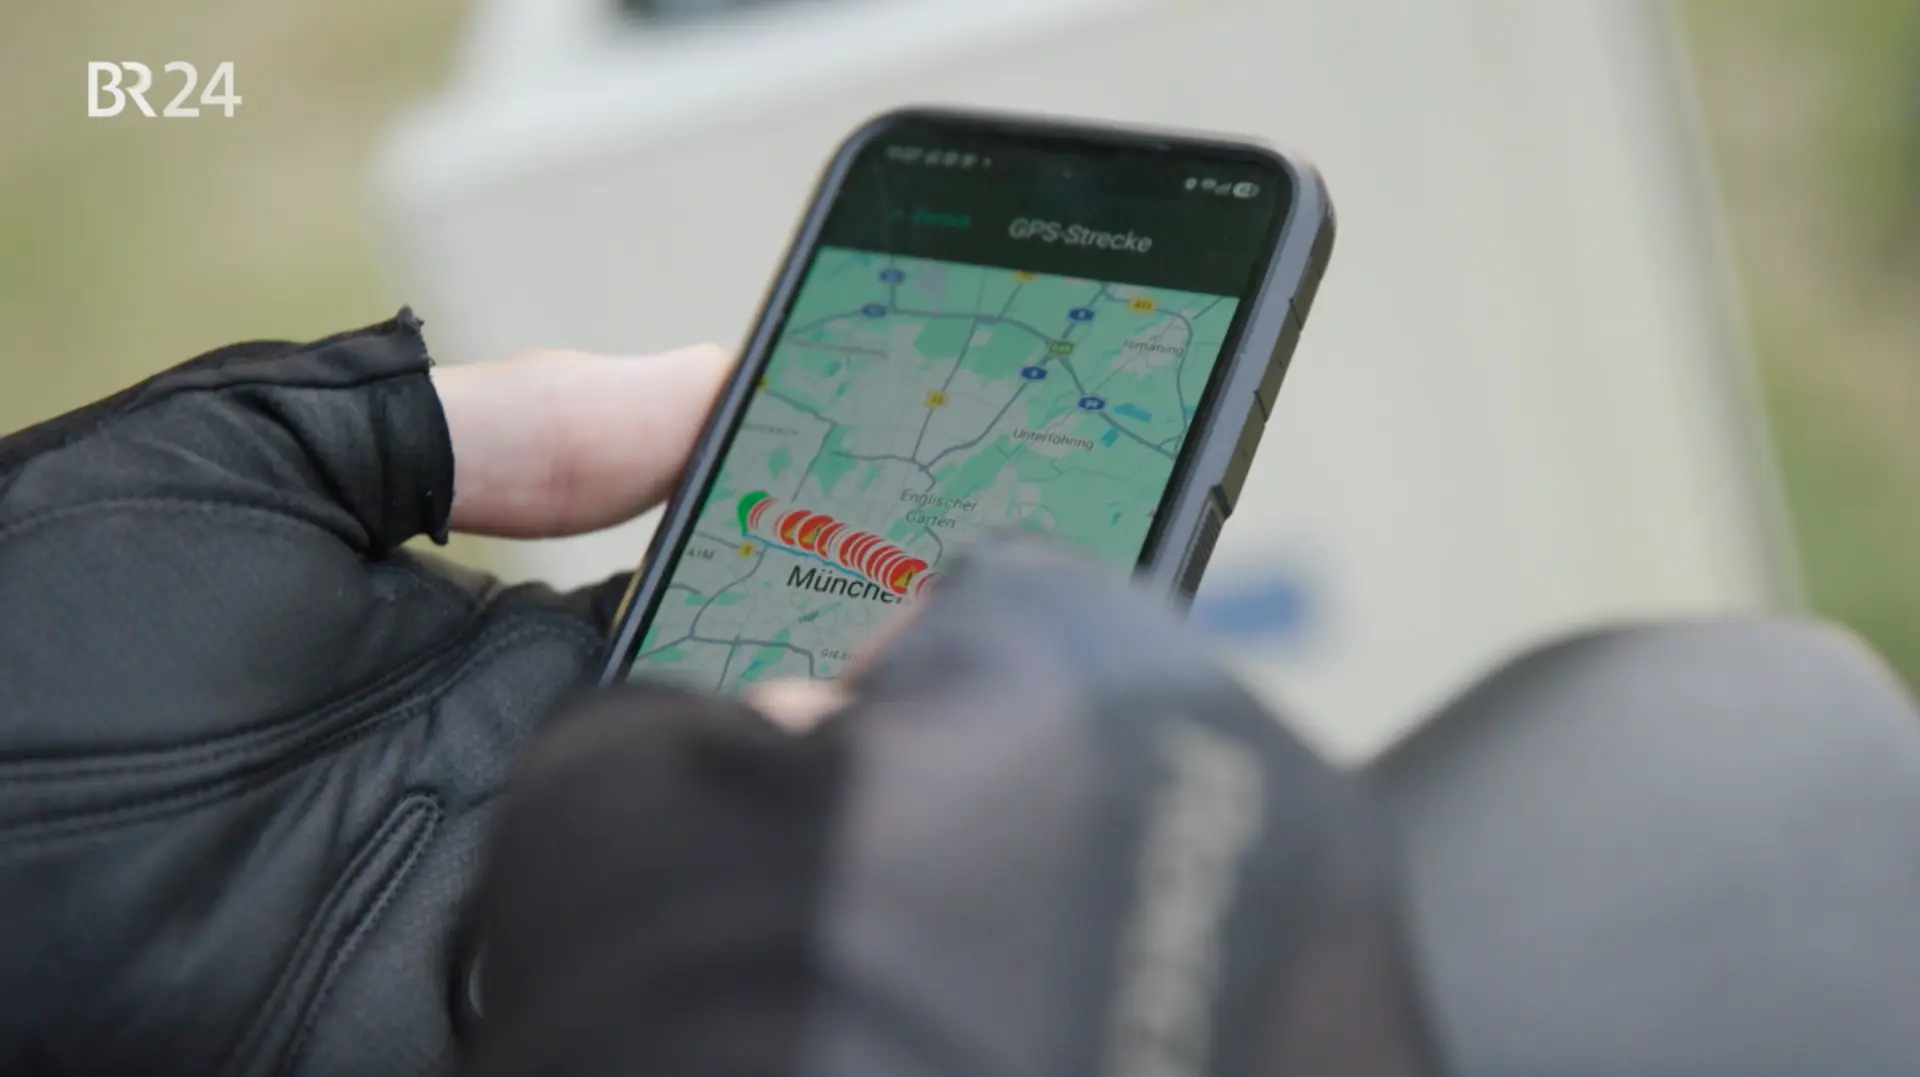
Go-Bike is our own app and the place the models meet the road. Riders mount a phone, get a warning when a situation turns dangerous, and review what happened afterwards. It is free, it is in both app stores, and is being used in multiple cities across Europe.


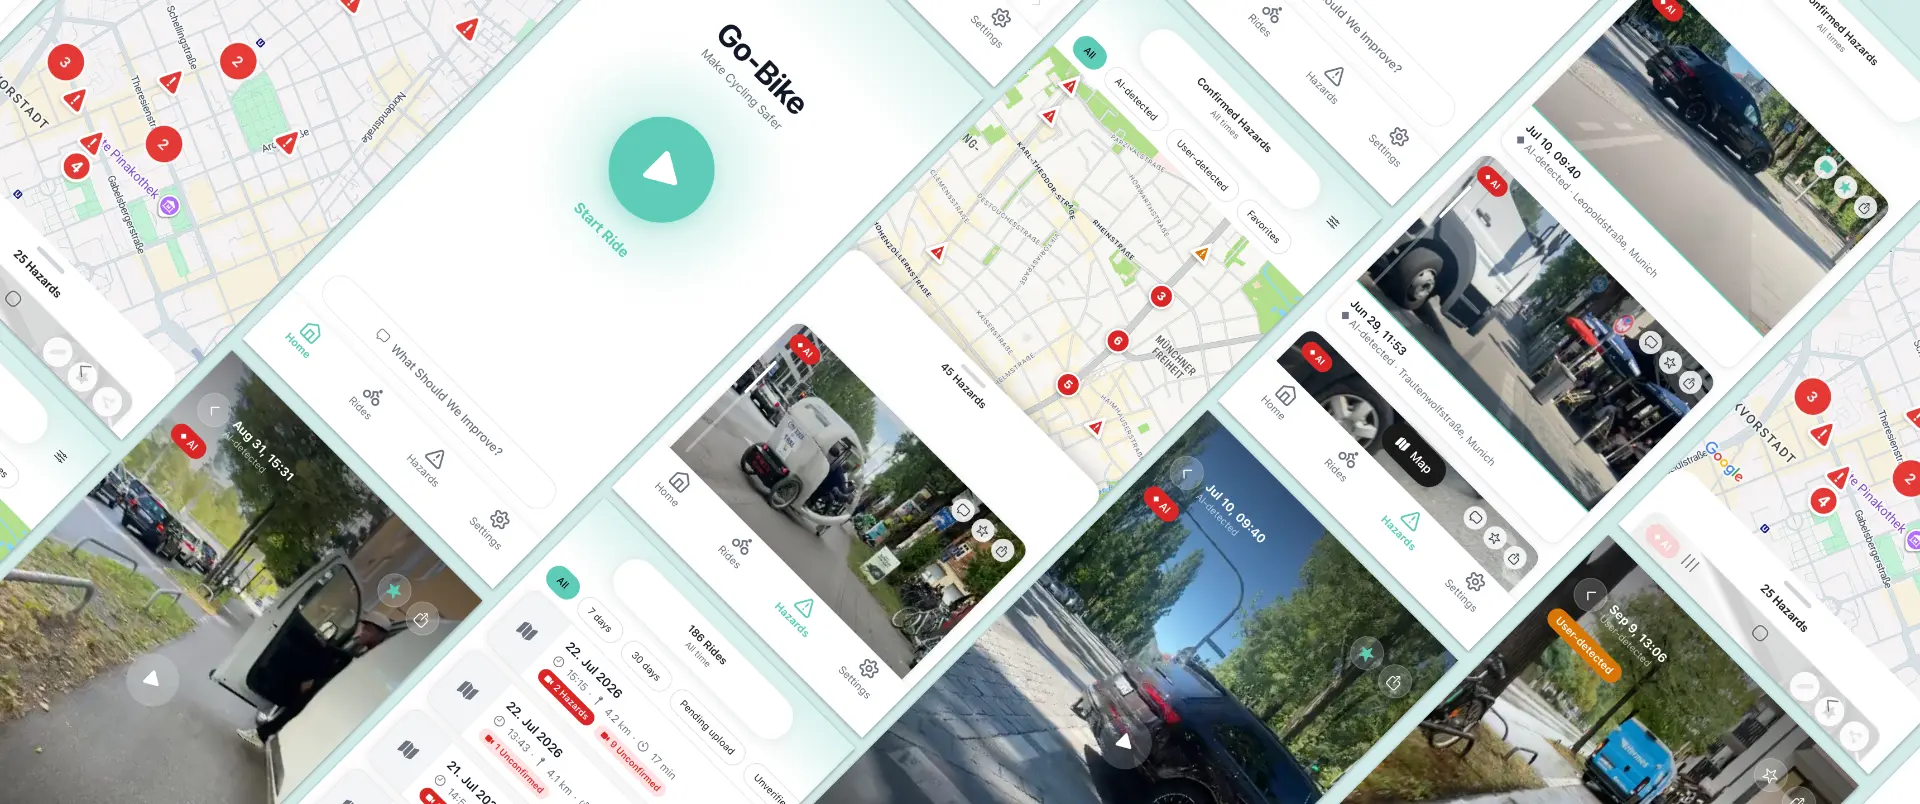
Riders hand us video of the streets they live on. That sets the standard for how the system is built. We follow the European GDPR in all countries worldwide.
Detection runs locally while riding. No continuous video stream leaves the phone.
Faces and number plates are blurred. Route starts and ends are cut, so a trip cannot be traced to a front door.
Riders decide what is shared and with whom, ride by ride, and can withdraw later.
Built against UK and EU GDPR, with published terms naming every category of data and every recipient.
Three founders who combine quantitative cognitive psychology and production machine learning with experience in building perception and decision solutions for mobility.

Technical
PhD in road-user modelling with multiple publications and patents Built perception behind ADAS, autonomous driving and smart glasses for Nissan, Meta, others Ex Director of Data Science at Humanising Autonomy

Product
Experienced Product Lead and Business Strategist, Diploma in Cognitive Psychology Built winning B2B SaaS and Consumer Products that scaled to millions of customers Ex Deloitte Strategy, ex tado°

Commercial
Serial founder and business development executive in wireless, telecom, automotive and AI Many years of experience in commercialising new technologies Commercial leadership for Humanising Autonomy, Soma Networks, Flarion, Qualcomm, SpiderCloud, and others
Cities and planners
Hazard evidence for your network, and a measure of what changed after you build.
Operators and insurers
Transport quality, rider behaviour and an evidence record for claims.
OEMs and developers
Detection and scoring inside your app, vehicle or camera system.